Figure 5.

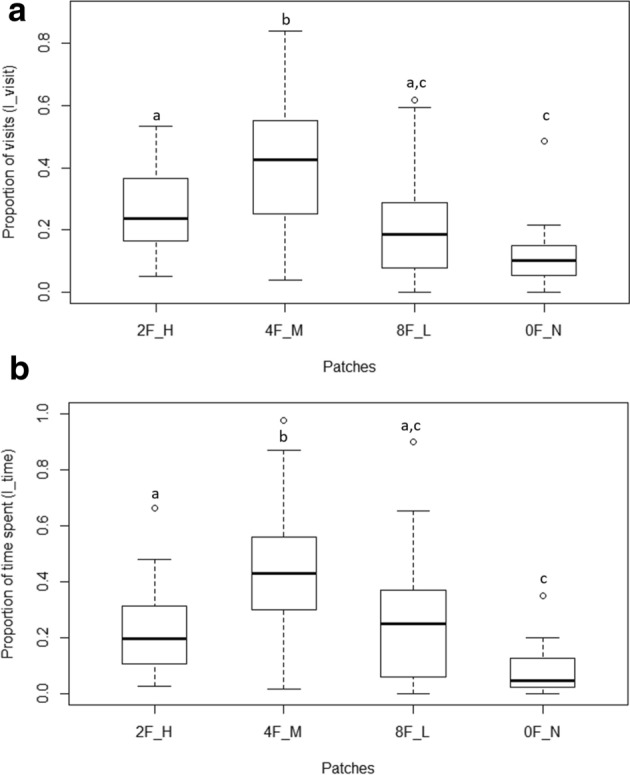
(a) Boxplots showing the proportion of visits by the male to the various chambers (E2 set). Males visited the medium (M) chamber (four females and medium plant density) significantly more than the high (H) (two females with high plant density), low (L) (eight females with low plant density) or Null (N) (one female with no plants) chambers. H patch also had greater proportion of visits compared to N patch. Similar alphabets placed above the plots indicate no statistical difference whereas dissimilar alphabets indicate significant statistical difference (p < 0.05). The lower and upper ends of the box plots represent the 1st and 3rd quartiles, the horizontal line within each boxplot is the median, and the upper and lower whiskers are the ×1.5 the interquartile range. Outlines are shown as open circles. (b) Boxplots showing the proportion of time spent (I_time) by the male in each of the chamber (E2 set). The test males spent statistically greater proportion of time in M patch compared to the other three patches. H patch also had greater proportion of time spent compared to N patch. Similar alphabets placed above the plots indicate no statistical difference whereas dissimilar alphabets indicate significant statistical difference (p < 0.05). The lower and upper ends of the box plots represent the 1st and 3rd quartiles, the horizontal line within each boxplot is the median, and the upper and lower whiskers are the ×1.5 the interquartile range. Outlines are shown as open circles.
