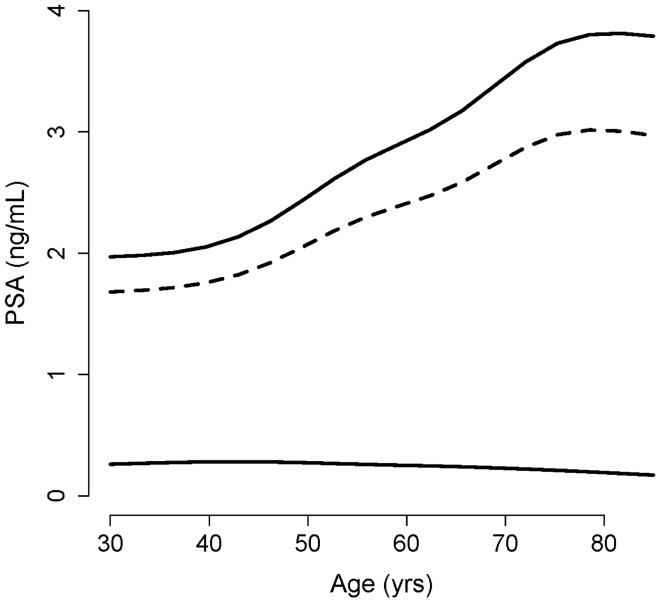
Figure 2.
The reference range of the disease for each age. The values were obtained from subset analysis of data of men aged 20–39, 40–49, 50–59, 60–69, 70–79, and ≥ 80 years. The two solid lines represent the lower and upper limits of the reference range; dashed line, the 95th percentile of PSA. The values for each age group were calculated based on the mean and SD of the distribution of Ln(PSA) in non-diseased people in each subset9.

