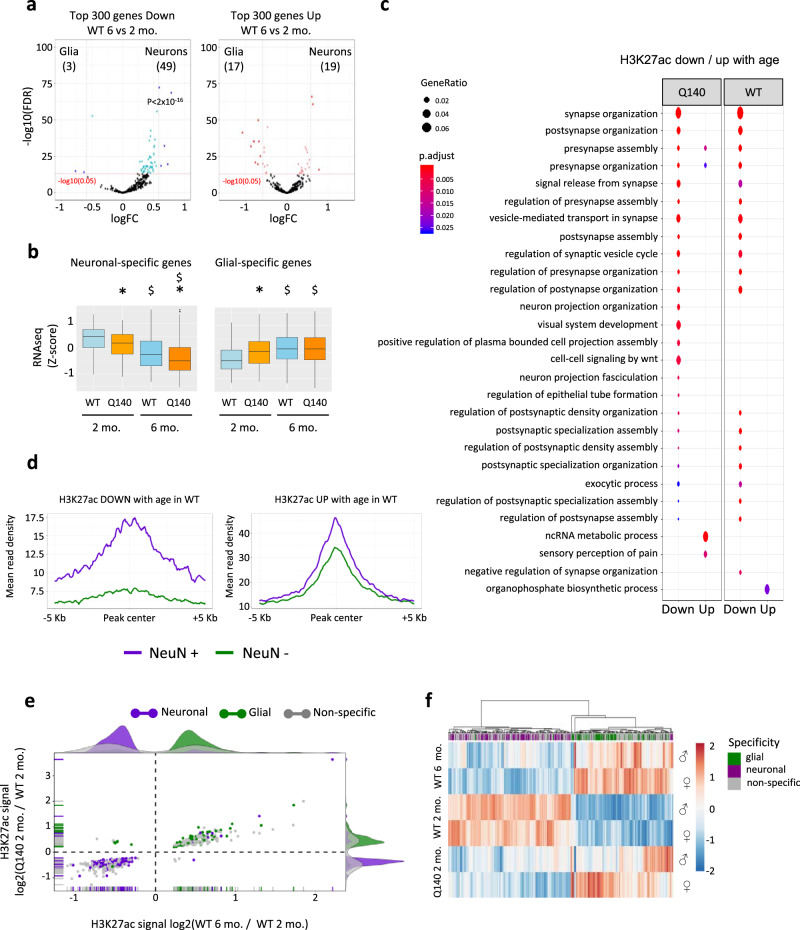
Fig. 3. Age-related epigenetic and transcriptional reprogramming of neuronal and glial identities are accelerated in the striatum of HD Q140 mice.
a Volcano plot representation of differential expression values between glial cells (astrocytes and microglia) and neurons (medium spiny neurons, MSNs, including D1 and D2 MSNs) using top-ranked (according to adj. P val) 300 genes down (left) and top-ranked 300 genes up (right) in WT striatum at 6 months vs 2 months. Genes down at 6 vs 2 months in WT striatum and significantly changed in neurons vs glial cells (FC >1 and adj. P value <0.05) are shown in blue; genes up at 6 vs 2 months in WT striatum and significantly changed in neurons vs glial cells (FC <1 and adj. P value) are shown in red. A binomial test (two-sided) was performed to assess enrichment in neuronal- or glial-specific genes. Adjustment for multiple comparisons was not performed. b Boxplots representing z-score values computed from RNAseq data generated in Q140 and WT striatum at 2 months and 6 months, considering genes increased in neurons vs glial cells (neuronal-specific genes, left) and genes increased in glial cells vs neurons (glial-specific genes, right). Boxplots show median, first quartile (Q1), third quartile (Q3) and range (min, Q1−1.5×(Q3–Q1); max, Q3+1.5×(Q3–Q1). Statistical analysis was performed using Kruskal–Wallis test (one-sided), with multiple testing correction using the Benjamini-Hochberg method. Neuronal-specific genes: *, P < 2 × 10⁻¹⁶, Q140 vs WT comparison at 2 months; *, P < 2 × 10⁻¹⁶, Q140 vs WT comparison at 6 months; $, P < 2 × 10⁻¹⁶, 6- vs 2-month comparison in WT; $, P = 2 × 10⁻¹³, 6- vs 2-month comparison in R6/1. Glial-specific genes: *, P < 2 × 10⁻¹⁶, Q140 vs WT comparison at 2 months; *; $, P < 2 × 10⁻¹⁶, 6- vs 2-month comparison in WT; $, P = 9 × 10⁻¹⁰, 6- vs 2-month comparison in R6/1. RNAseq data from transcriptomic databases5,10 were used for these analyses. c Gene Ontology analysis of regions differentially enriched in H3K27ac in 6- vs 2-month striatal samples, in Q140 and WT contexts (FDR < 0.05). Significant biological processes are shown using dot size proportional to gene ratio and heatmap reflecting adj. P value. d Metaprofiles showing H3K27ac signal in NeuN+ and NeuN− sorted nuclei, considering differentially enriched peaks in WT striatal samples of 6 vs 2 months. FC <1 and adj. P value <0.05, down, left; FC >1 and adj. P value <0.05, up, right. e Scatter plot and density population graphs representing log2 of fold-change in H3K27ac at regions significantly changed (P < 0.05) both in Q140 vs WT samples at 2 months and in WT samples at 6 vs 2 months. Differentially H3K27ac-enriched regions distribute in three categories: non-specific (Non-specific, grey), neuronal-specific (Neuronal, purple) and glial-specific (Glial, green). f Heatmap representing z-score values of H3K27ac signal at regions differentially enriched in H3K27ac (P < 0.05) both in Q140 vs WT samples at 2 months and in WT samples at 6 vs 2 months. Differentially H3K27ac-enriched regions distribute in three categories: non-specific (Non-specific, grey), neuronal-specific (Neuronal, purple) and glial-specific (Glial, green); hierarchical clustering was performed according to H3K27ac signal. Source data are provided as a Source Data file.

