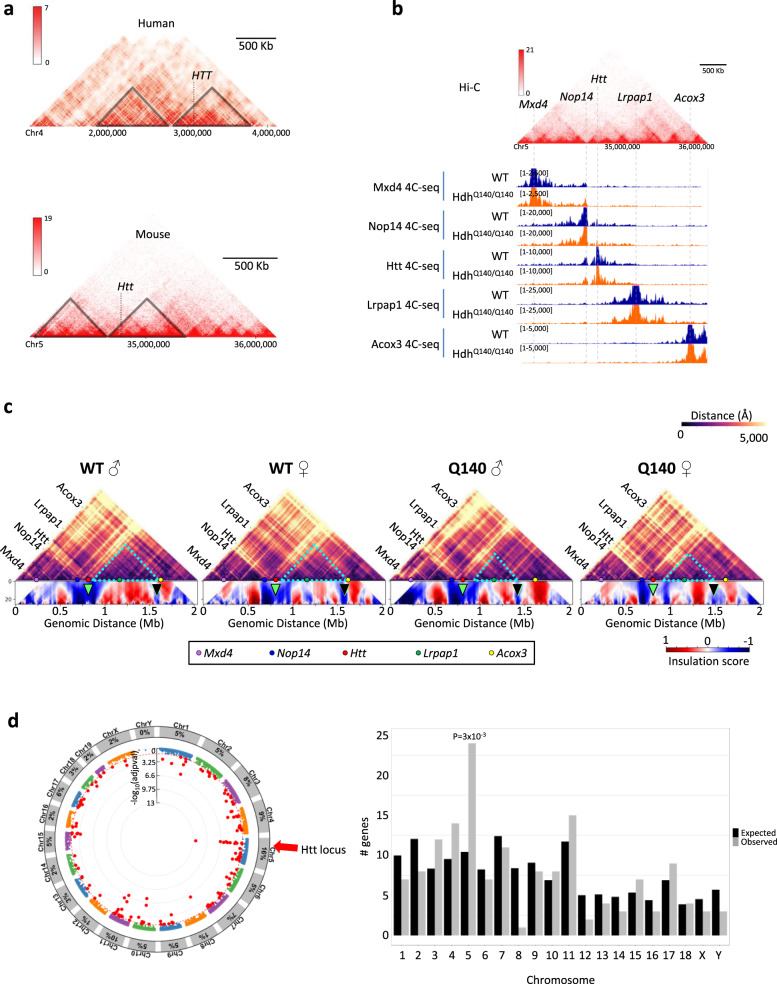
Fig. 5. The HD mutation induces disease locus-specific alterations of chromatin architecture and transcription regulation in the striatum of Q140 mice.
a Hi-C data capture showing 3 and 2.3 megabase genome region from human hippocampus and mouse cortical neurons, respectively. In both cases, Htt is in the vicinity of TAD borders (~250 Kb for human HTT and ~115 Kb for mouse Htt). b Genome browser representation of mouse cortical neuron Hi-C data, zooming on the region encompassing Htt, and aligned with 4C-seq data generated in this study using striatal tissue of WT (blue) and Q140 (orange) mice. The genomic locations of Mxd4, Nop14, Htt, Lrpap1 and Acox3 4C-seq baits are indicated. c Virtual Hi-C heatmap of contact matrices for WT and Q140 striatal data at Htt locus (top). Colour scale indicates distance between regions in Angstroms (Å). Colour spheres depicting the location of the original baits are shown. In the bottom, insulation score cumulative heatmaps were computed using bins from 4 (40 Kb) to 30 (300 Kb) adding 1 bin each time37. Green arrow shows the location of Htt at TAD boundary. Black arrow shows the location of subTAD boundary downstream to Htt, displaced in Q140 mice data. d Left, Manhattan plot representing the distribution of differentially expressed genes (DEGs) in Q140 vs WT striatum at 2 months across the different chromosomes. Significant DEG (adj. P value <0.05) are labelled as red dots and the percentage of DEG within each chromosome is shown in peripheral arc. Right, Histogram showing chromosome distribution of DEGs in Q140 vs WT striatum at 2 months of age. Observed numbers were compared with expected numbers for each chromosome and a binomial test (two-sided) was used to assess significant differences, with multiple testing correction using the Bonferroni correction. Source data are provided as a Source Data file.

