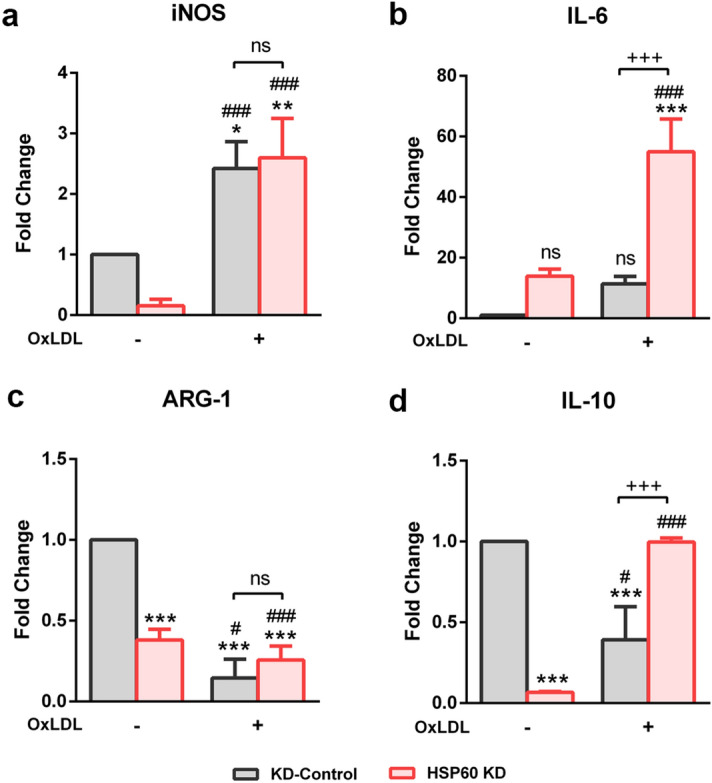
Figure 9.

OxLDL induced polarization of HSP60 KD TDMs. OxLDL induced polarization events were checked by assessing the mRNA expression of M1 markers (a) iNOS and (b) IL-6 and M2 markers (c) ARG-1 and (d) IL-10 in OxLDL treated KD-Control and HSP60 KD TDMs. Data were expressed as Mean ± SEM (n = 3). *p < 0.05, **p < 0.01, ***p < 0.001 vs untreated KD-Control. ###p < 0.001 vs untreated HSP60 KD. +p < 0.05, +++p < 0.001 KD-Control group vs HSP60 KD group, ns non-significant, Two-way ANOVA followed by Tukey’s multiple comparison test.
