Figure 2.
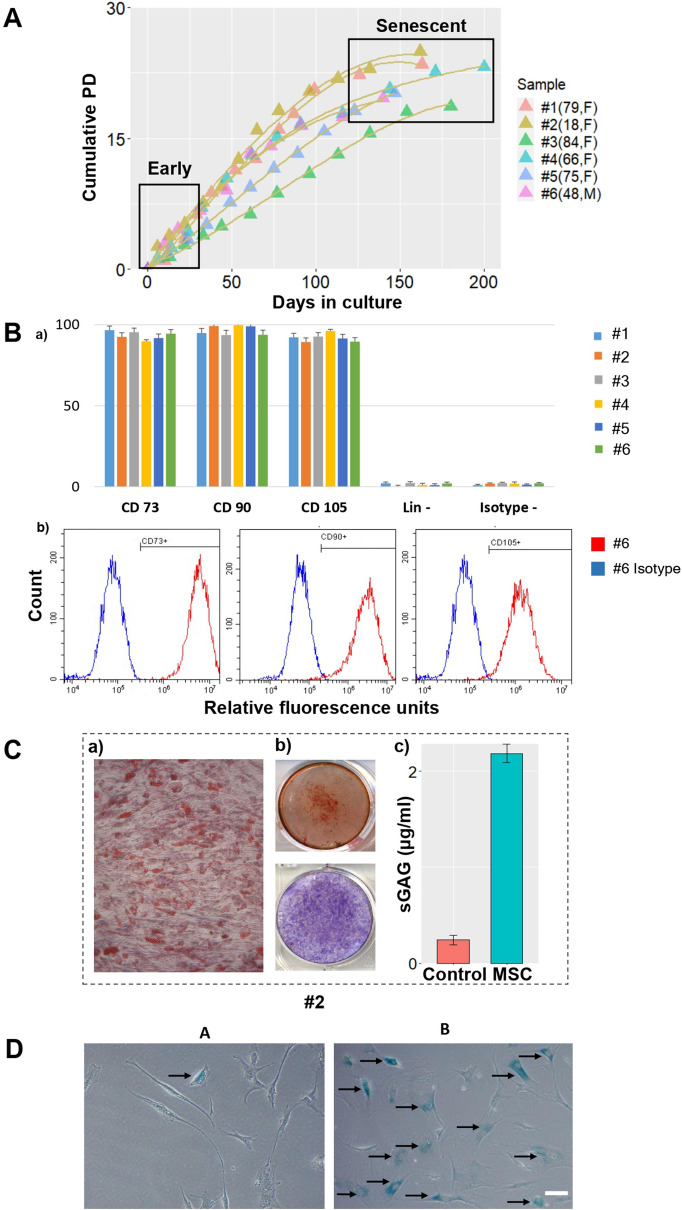
Characterisation of hMSCs used in this study. (A) Cumulative population doubling of the six selected donor samples (biological repeats n = 6) collected through in vitro expansion over a period of 7 months. Early passage cells are defined when their cumulative PD value is closest to six and senescent passage cells are defined as cells failed to double in 2 weeks’ time. (B): (a) Combined data on ISCT phenotypic characterization of all six donor MSC samples on CD73, CD90, CD105, Lin-: lineage negative, Isotype-: isotype control antibodies. Bars represent mean values and error bars represent standard deviations (SDs) (b) Representative histograms for donor #6 on CD73, CD90 and CD105 characterization. (C) Representative hMSCs differentiation results (donor #2) from left to right: (a) Oil Red O stained lipid vesicles after adipogenesis (b) Alizarin red staining demonstrating calcium deposition (middle upper) and alkaline phosphatase (middle lower) both indicating osteogenic differentiation (c) hMSCs chondrogenesis with sGAG levels higher than a control sample of hMSCs not cultured in chongrogenic media. (D) -galactosidase staining images of early (A) and senescent passages (B) of a selected donor sample. At least 200 cells were measured and counted per -galactosidase staining experiment. Arrows indicate -galactosidase positive hMSCs. Scale bar indicates 50 .

