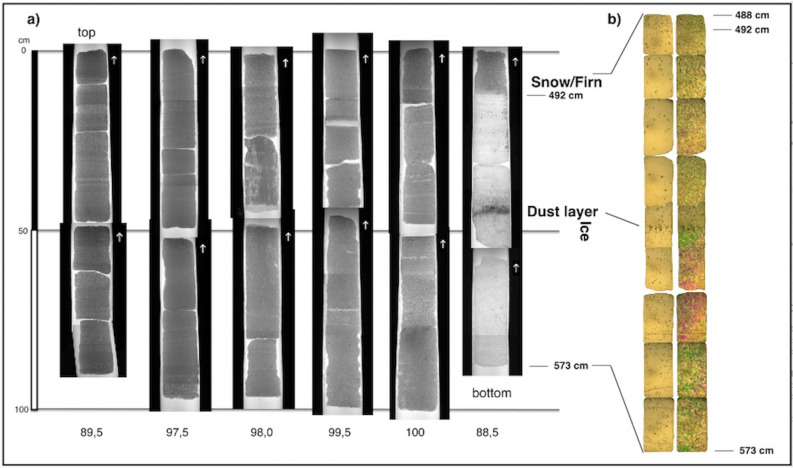
Figure 1.
Ice core stratigraphy. (a) Visual stratigraphy of drilled ice core under transmitted light: below each section the total length of the single run is reported, from the top (upper left) to the bottom run (lower right). (b) Thin sections of the bottom part of the core with ice facies; on the left, the single polarizer images which highlight the air bubble size and density; on the right, crossed polarization filters which show ice crystal structure and size, and crystal boundaries. The sections correspond from left to right to DNA metabarcoding samples P1 to P6.

