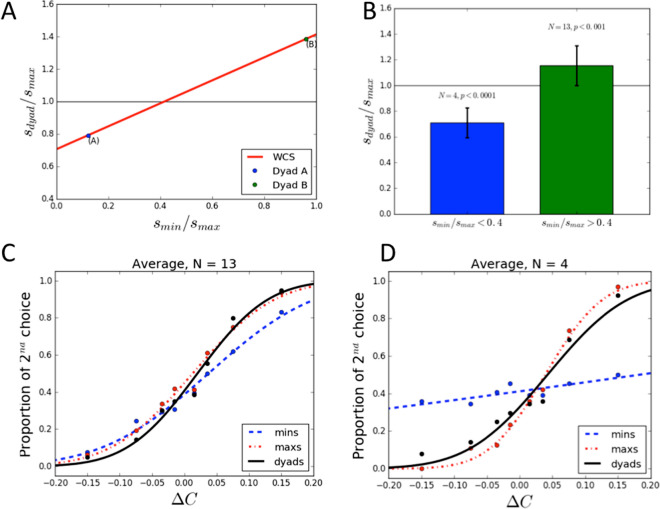
Figure 2.
Experimental results. (A) Theoretical prediction of the Weighted Confidence Sharing model (WCS model): dyads outperform their best individual members () if members have similar sensitivities (). (B) Performance of dyads whose members have similar (green) or different (blue) sensitivities. (C,D) Average psychometric functions of the worst (blue) and best (red) individual members, compared to the dyad (black). Dots are the average percentage of 2 stimuli chosen as answer, for each contrast difference in the experiment. Lines are fitted cumulative Gaussian functions. Steeper slopes correspond to higher sensitivities.

