Figure 3.

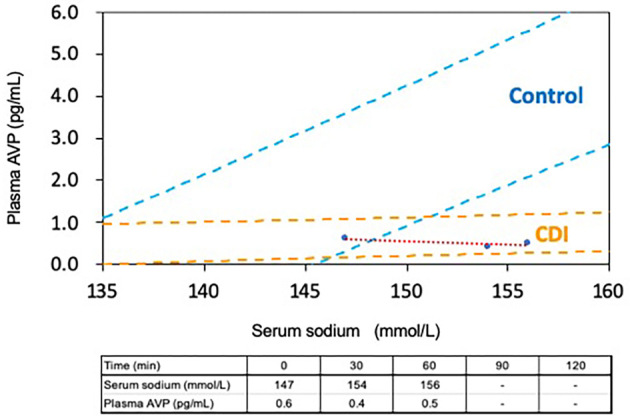
Serum sodium and plasma AVP concentrations during hypertonic saline infusion: The x-axis shows the level of serum sodium (mmol/L). The y-axis shows the level of plasma AVP (pg/mL). AVP: arginine vasopressin, CDI: central diabetes insipidus

Serum sodium and plasma AVP concentrations during hypertonic saline infusion: The x-axis shows the level of serum sodium (mmol/L). The y-axis shows the level of plasma AVP (pg/mL). AVP: arginine vasopressin, CDI: central diabetes insipidus