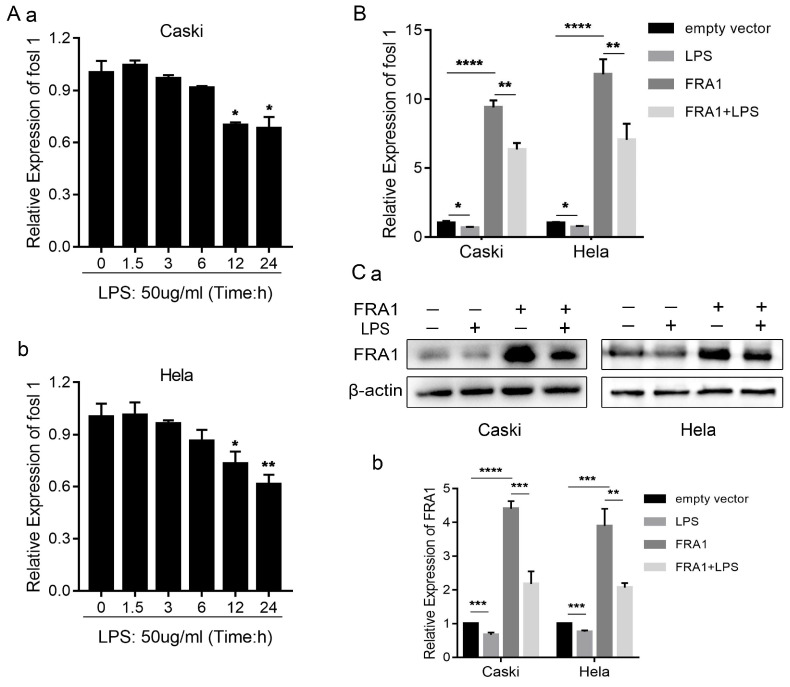
Figure 1.
LPS affects FRA1 expression in cervical cancer cells: (A) qRT-PCR analysis of FOSL1 mRNA levels in Caski and Hela cell lines at different time points after LPS (50ug/ml). (B) qRT-PCR analysis of FOSL1 mRNA levels in Caski-FRA1/Caski-empty vector and Hela-FRA1/Hela-empty vector cells after LPS (50ug/ml). (C) (a) Western blotting analysis of FRA1 protein levels in Caski-FRA1/Caski-empty vector and Hela-FRA1/Hela-empty vector cells after LPS (50ug/ml). (b) Represent relative expression levels of FRA1. *P<0.05, **P<0.01, ***P<0.001, ****P<0.0001.

