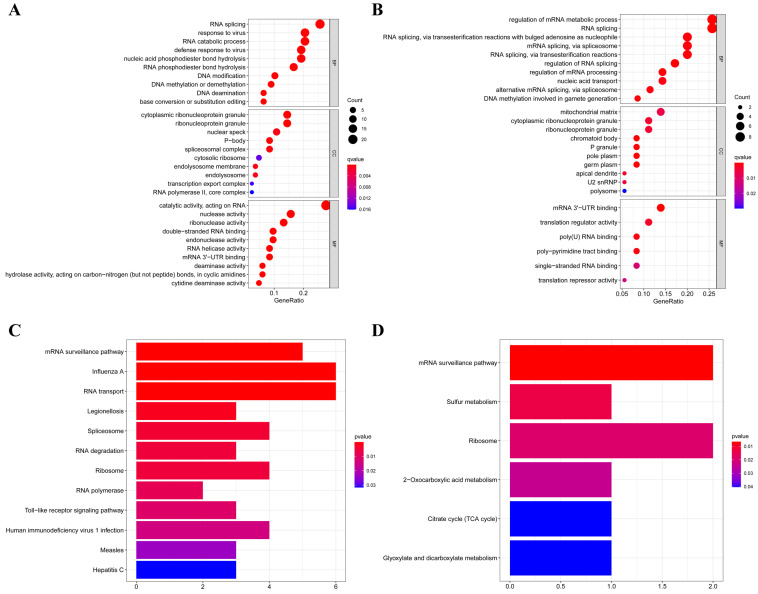
Figure 3.
GO and KEGG pathway enrichment analyses of aberrantly expressed RBPs in RCC. (A) GO enrichment analysis of upregulated RBPs; (B) GO enrichment analysis of downregulated RBPs; (C) KEGG pathway enrichment analysis of upregulated RBPs; (D) KEGG pathway enrichment analysis of downregulated RBPs.

