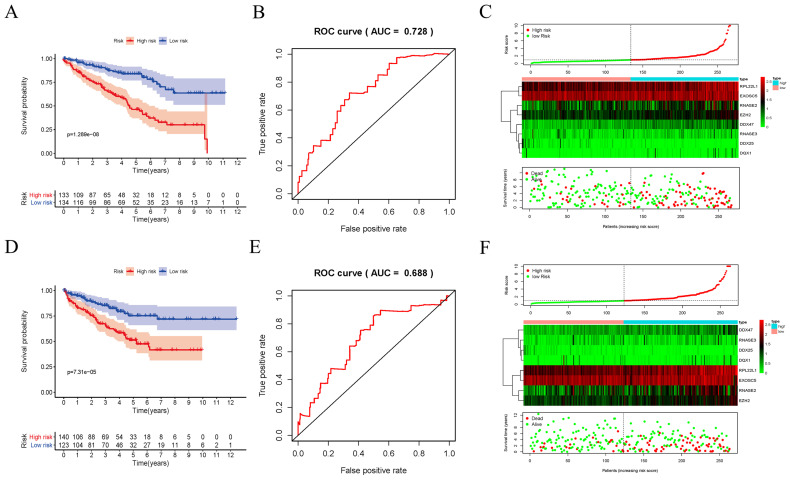
Figure 7.
Risk score analysis of risk model in train-group and test-group. (A) Survival curve for low- and high-risk subgroups in train-group; (B) ROC curves for forecasting OS in train-group; (C) Risk score, expression heat map and survival status in train-group; (D) Survival curve for low- and high-risk subgroups in test-group; (E) ROC curves for forecasting OS in test-group; (F) Risk score, expression heat map and survival status in test-group.

