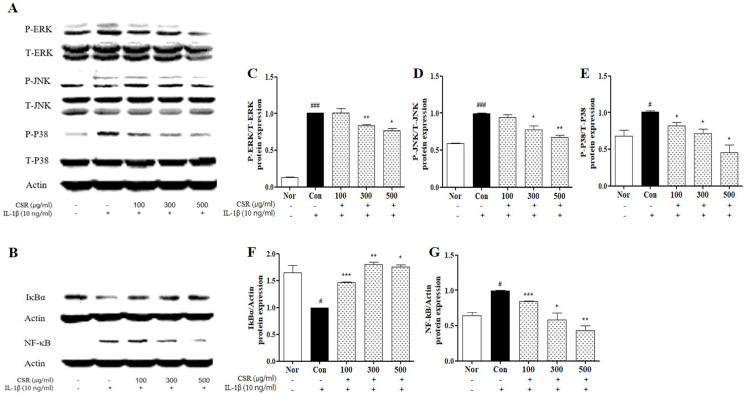
Figure 4.
The effects of CSR on MAPK/ NF-κB signaling protein expressions in IL-1β-stimulated chondrocytes. (A, B) The level of NF-κB, phosphor-ERK1/2, JNK, P38 was examined by Western blot. (C-G) Evaluation of protein expression by image J. Each dataset represents the mean±SEM. ###p < 0.001, #p < 0.05 compared with normal and ***p < 0.001, **p < 0.01, *p < 0.05 compared with the control group.

