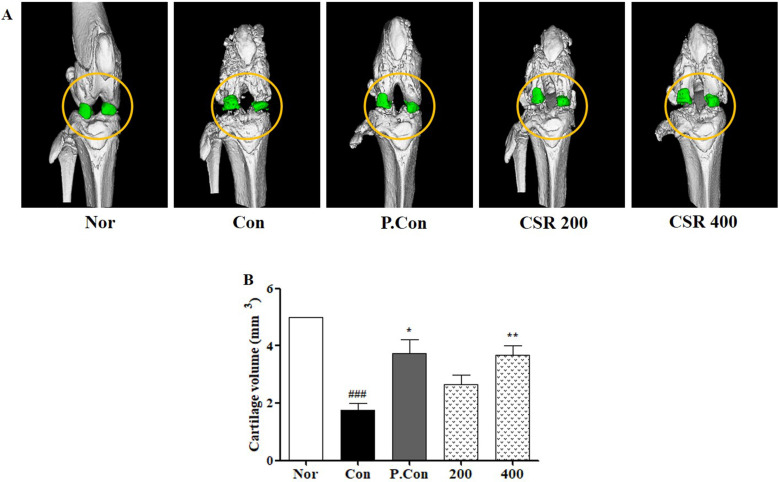
Figure 8.
The effects of CSR on the femur and knee joints' volume in MIA-induced OA. (A) Three-dimension micro-CT images and (B) cartilage volume were examined by the micro-CT system. Each dataset represents the mean±SD. ###p<0.001 compared with the normal group and **p<0.01, *p<0.05 compared with the control group.

