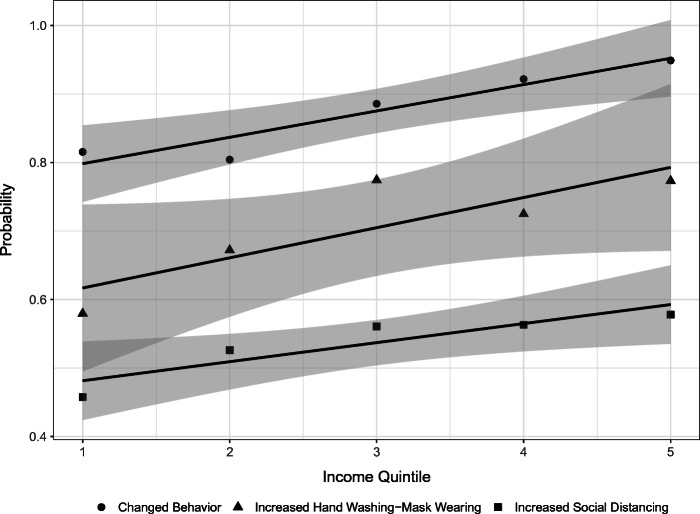
Fig. 1.
Probability of changes in self-protective behaviors by income quintile: This figure shows the proportion of US respondents within a household income quintile that reports changes in any self-protective behaviors; reports increased social distancing; and increased hand washing-mask wearing. We also plot the estimated trend relating each changed behavior to income quintiles. The gray area is the associated 95% confidence interval

