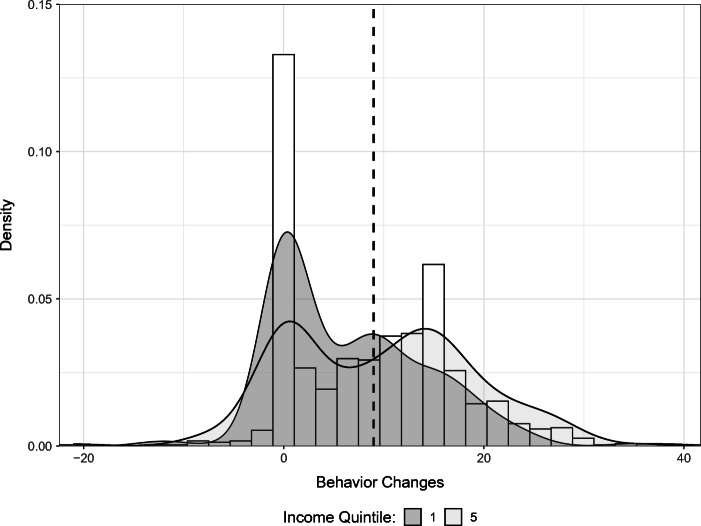
Fig. 3.
Distribution of behavior changes: Distribution of behavior changes from before the pandemic to a few weeks after the pandemic started for all 15 behaviors included in our survey data. Changes are normalized such that self-protecting changes are positive and reductions in these behaviors are negative. The densities for the lowest and highest income quintiles are broken out separately. The dashed line represents the mean number of behavior changes across all income quintiles

