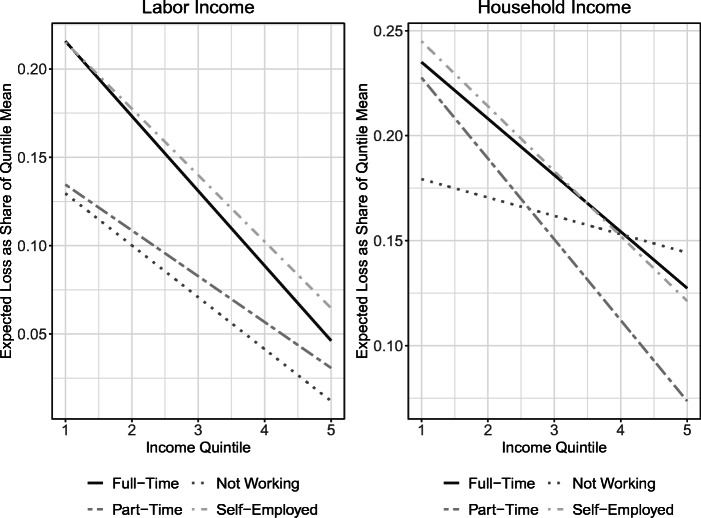
Fig. 6.
Expected income losses by income and labor status: The left panel summarizes expected labor income losses across income quintiles and labor statuses (i.e., working full-time, part-time, self-employed, or not working at all). The right panel summarizes expected household income losses along the same two dimensions. In both panels, expected losses are normalized by the mean income of the respondent’s quintile. To improve readability, we have omitted the markers for the quintile means and display the linear trend. These trends were tested for statistical significance

