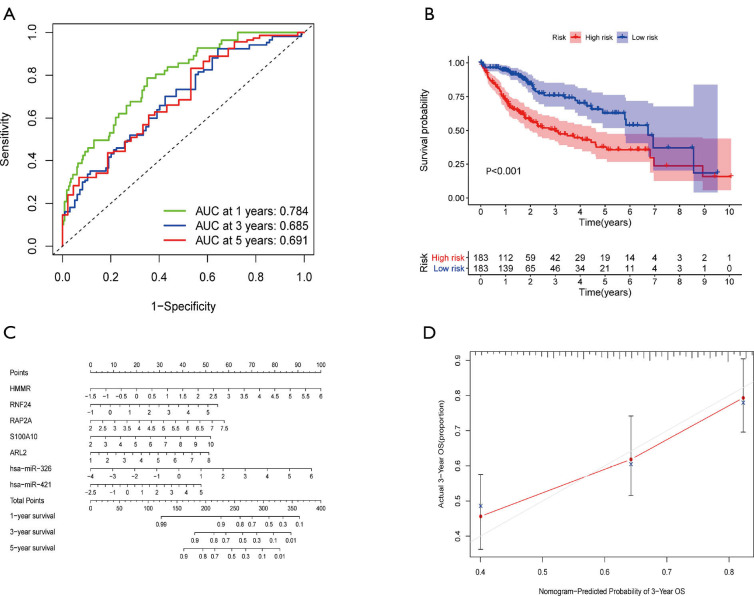
Figure 4.
Evaluation of a ceRNA risk model and construction of a nomogram based on the 7 hub RNAs. (A) ROC curve of the ceRNA model was shown and the AUC of 1-, 3- and 5-year OS were 0.784, 0.685, and 0.691 respectively. (B) The K-M curve showing that the high-risk groups (red curve) had a worse OS than the low-risk (blue curve) according to the median cutoff value of risk scores (P<0.001). (C) A nomogram was established based on the 7 hub RNAs. (D) A calibration diagram demonstrating the discrimination and accuracy of the nomogram. OS, overall survival; ROC, receiver operating characteristic; AUC, area under the curve; ceRNA, competing endogenous RNA network; ROC, receiver operating characteristic; AUC, area under the curve; K-M, Kaplan-Meier.

