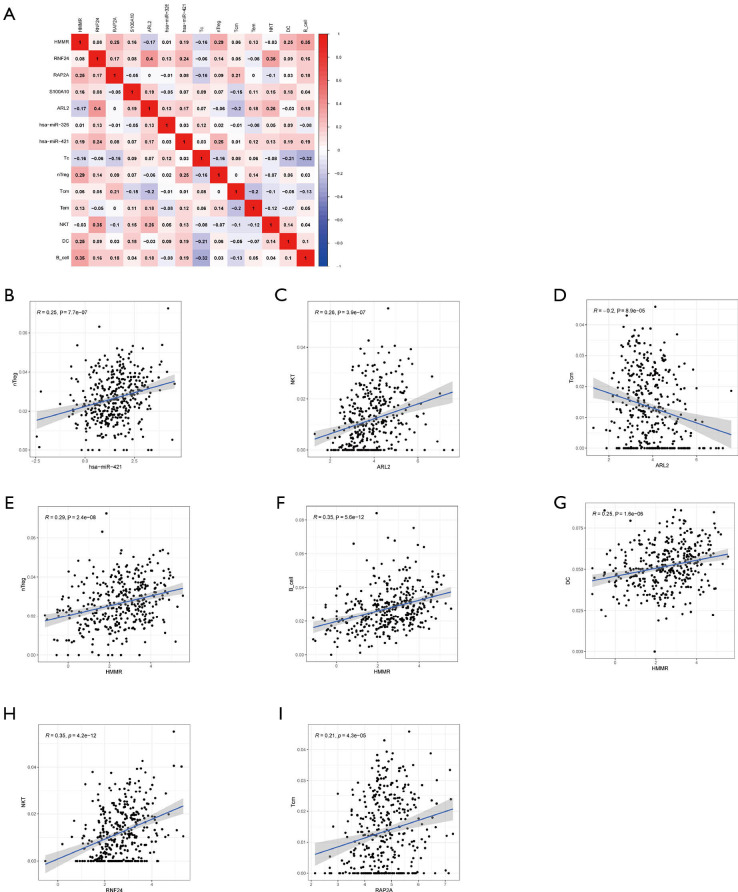
Figure 8.
Correlation of ceRNA networks and TICs. (A) Correlation analysis of the model RNAs and TICs and the R value in the figure was calculated by Pearson correlation coefficient. A red box indicates a positive correlation while a blue box indicates a negative correlation. Scatter plots show the relationship between hub genes of ceRNA and TICs. (B) hsa-miR-421 and nTreg cells (R=0.25). (C) mRNA ARL2 and NKT cells (R=0.26). (D) ARL2 and Tcm cells (R=−0.2). (E) HMMR and nTreg cells (R=0.29). (F) HMMR and B cells (R=0.35). (G) HMMR and DCs (R=0.25). (H) RNF24 and NKT cells (R=0.35). (I) RAP2A and Tcm cells (R=0.21). (B,C,D,E,F,G,H,I) All P values <0.001. Tcm, central memory T (cell_; NKT, natural killer T (cell_; DC, dendritic cell; R, correlation coefficient. ceRNA, competing endogenous RNA network; TICs, tumor-infiltrating cells; DCs, dendritic cells; NKT, natural killer T.

