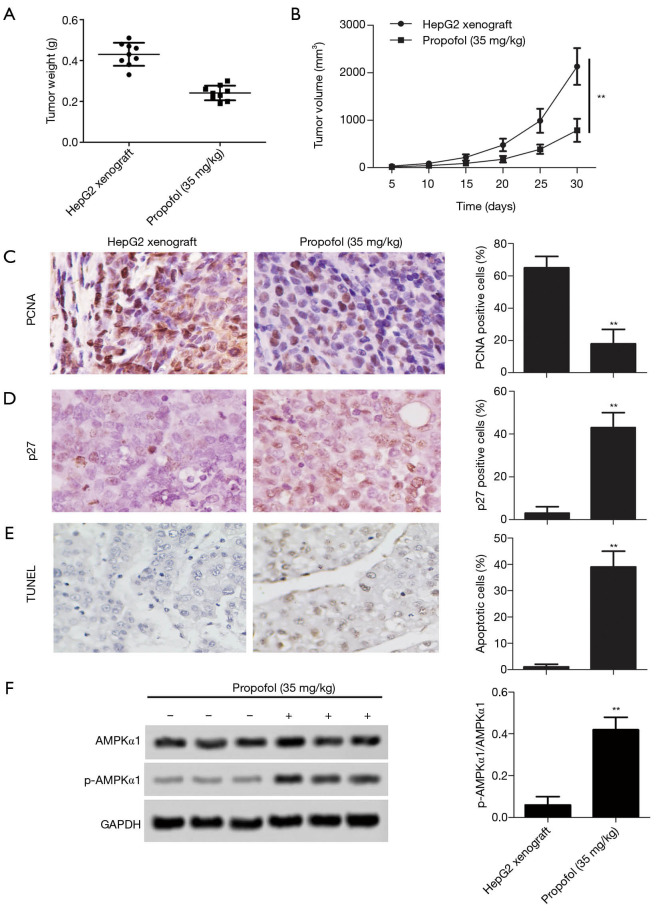
Figure 5.
The effect of propofol in vivo. (A,B) The tumor weight and volume was determined; (C) the expression of PCNA (proliferating cell nuclear antigen) was measured by immunohistochemistry analysis (magnification, ×400); (D) the expression of p27 was measured by immunohistochemistry analysis (magnification, ×400); (E) cell apoptosis was detected by TUNEL staining (magnification, ×400); (F) the protein expression levels of p-AMPKα1 (phospho-AMP-activated protein kinase α1) were detected by western blot. Also, the histogram revealed the semi-quantitative analysis of the protein. **, P<0.01 versus HepG2 xenograft group.

