
Figure 2. . Validation of STING antibody.
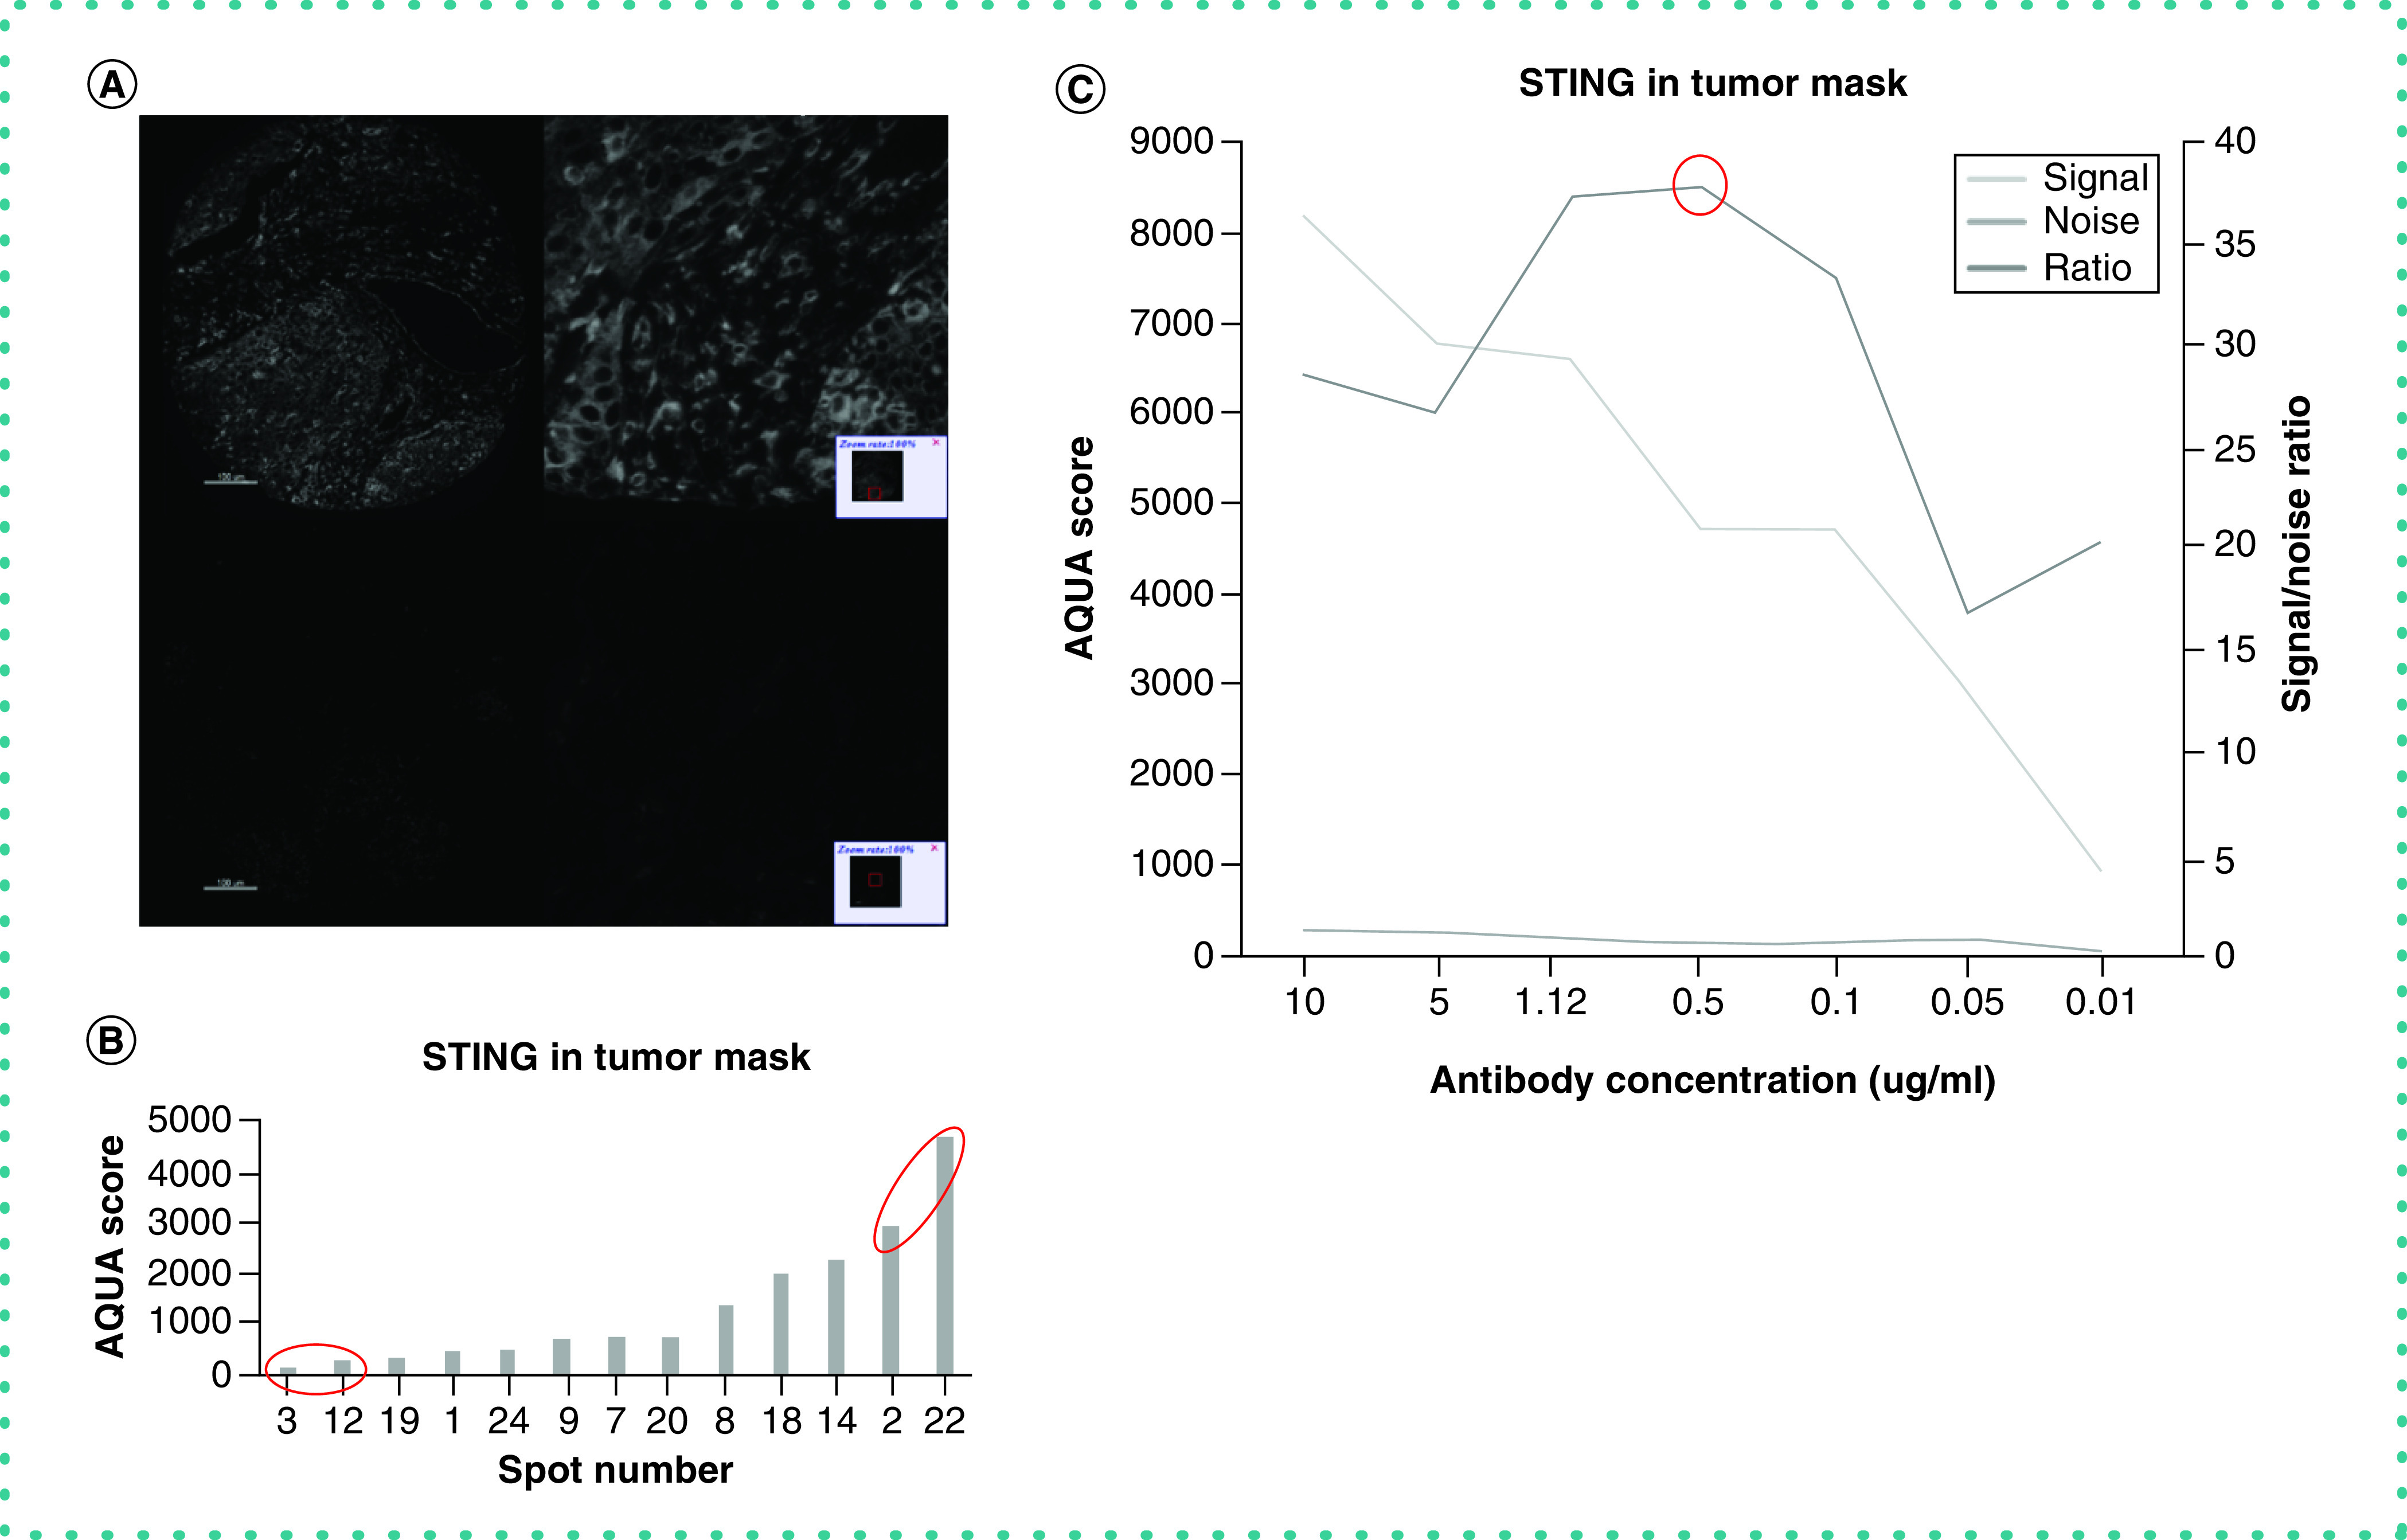
(A) Expected localization of expression. Representative images of high (top) versus low (bottom) signal intensity spots (AQUA scores = 2971.7 and 124.8, respectively). As anticipated, cytoplasmic staining pattern is observed in both tumor and immune cells in the stroma. Isotype-specific HRP-conjugated secondary antibodies were used with a tyramide-based amplification system to generate the fluorescent signal. The Cy5 channel was used for visualization of the STING antibody. (B) Dynamic range chart shows STING IF scores quantified in tumor mask on a control TMA that was created for assay validation. Signal-to-noise ratio is measured by dividing the average IF scores of the upper 10% of spots by the average IF scores of the lower 10% of spots, each indicated with a red circle. (C) Antibody optimization. Signal-to-noise ratio curve for STING antibody. We used seven different concentrations (0.01–10 μg/ml) that span over two full logs of concentration. As seen, the peak for the signal-to-noise ratio is at 0.5 μg/ml, representing the optimal concentration for this antibody.
HRP: Horseradish peroxidase; IF: Immunofluorescence; TMA: Tissue microarray.