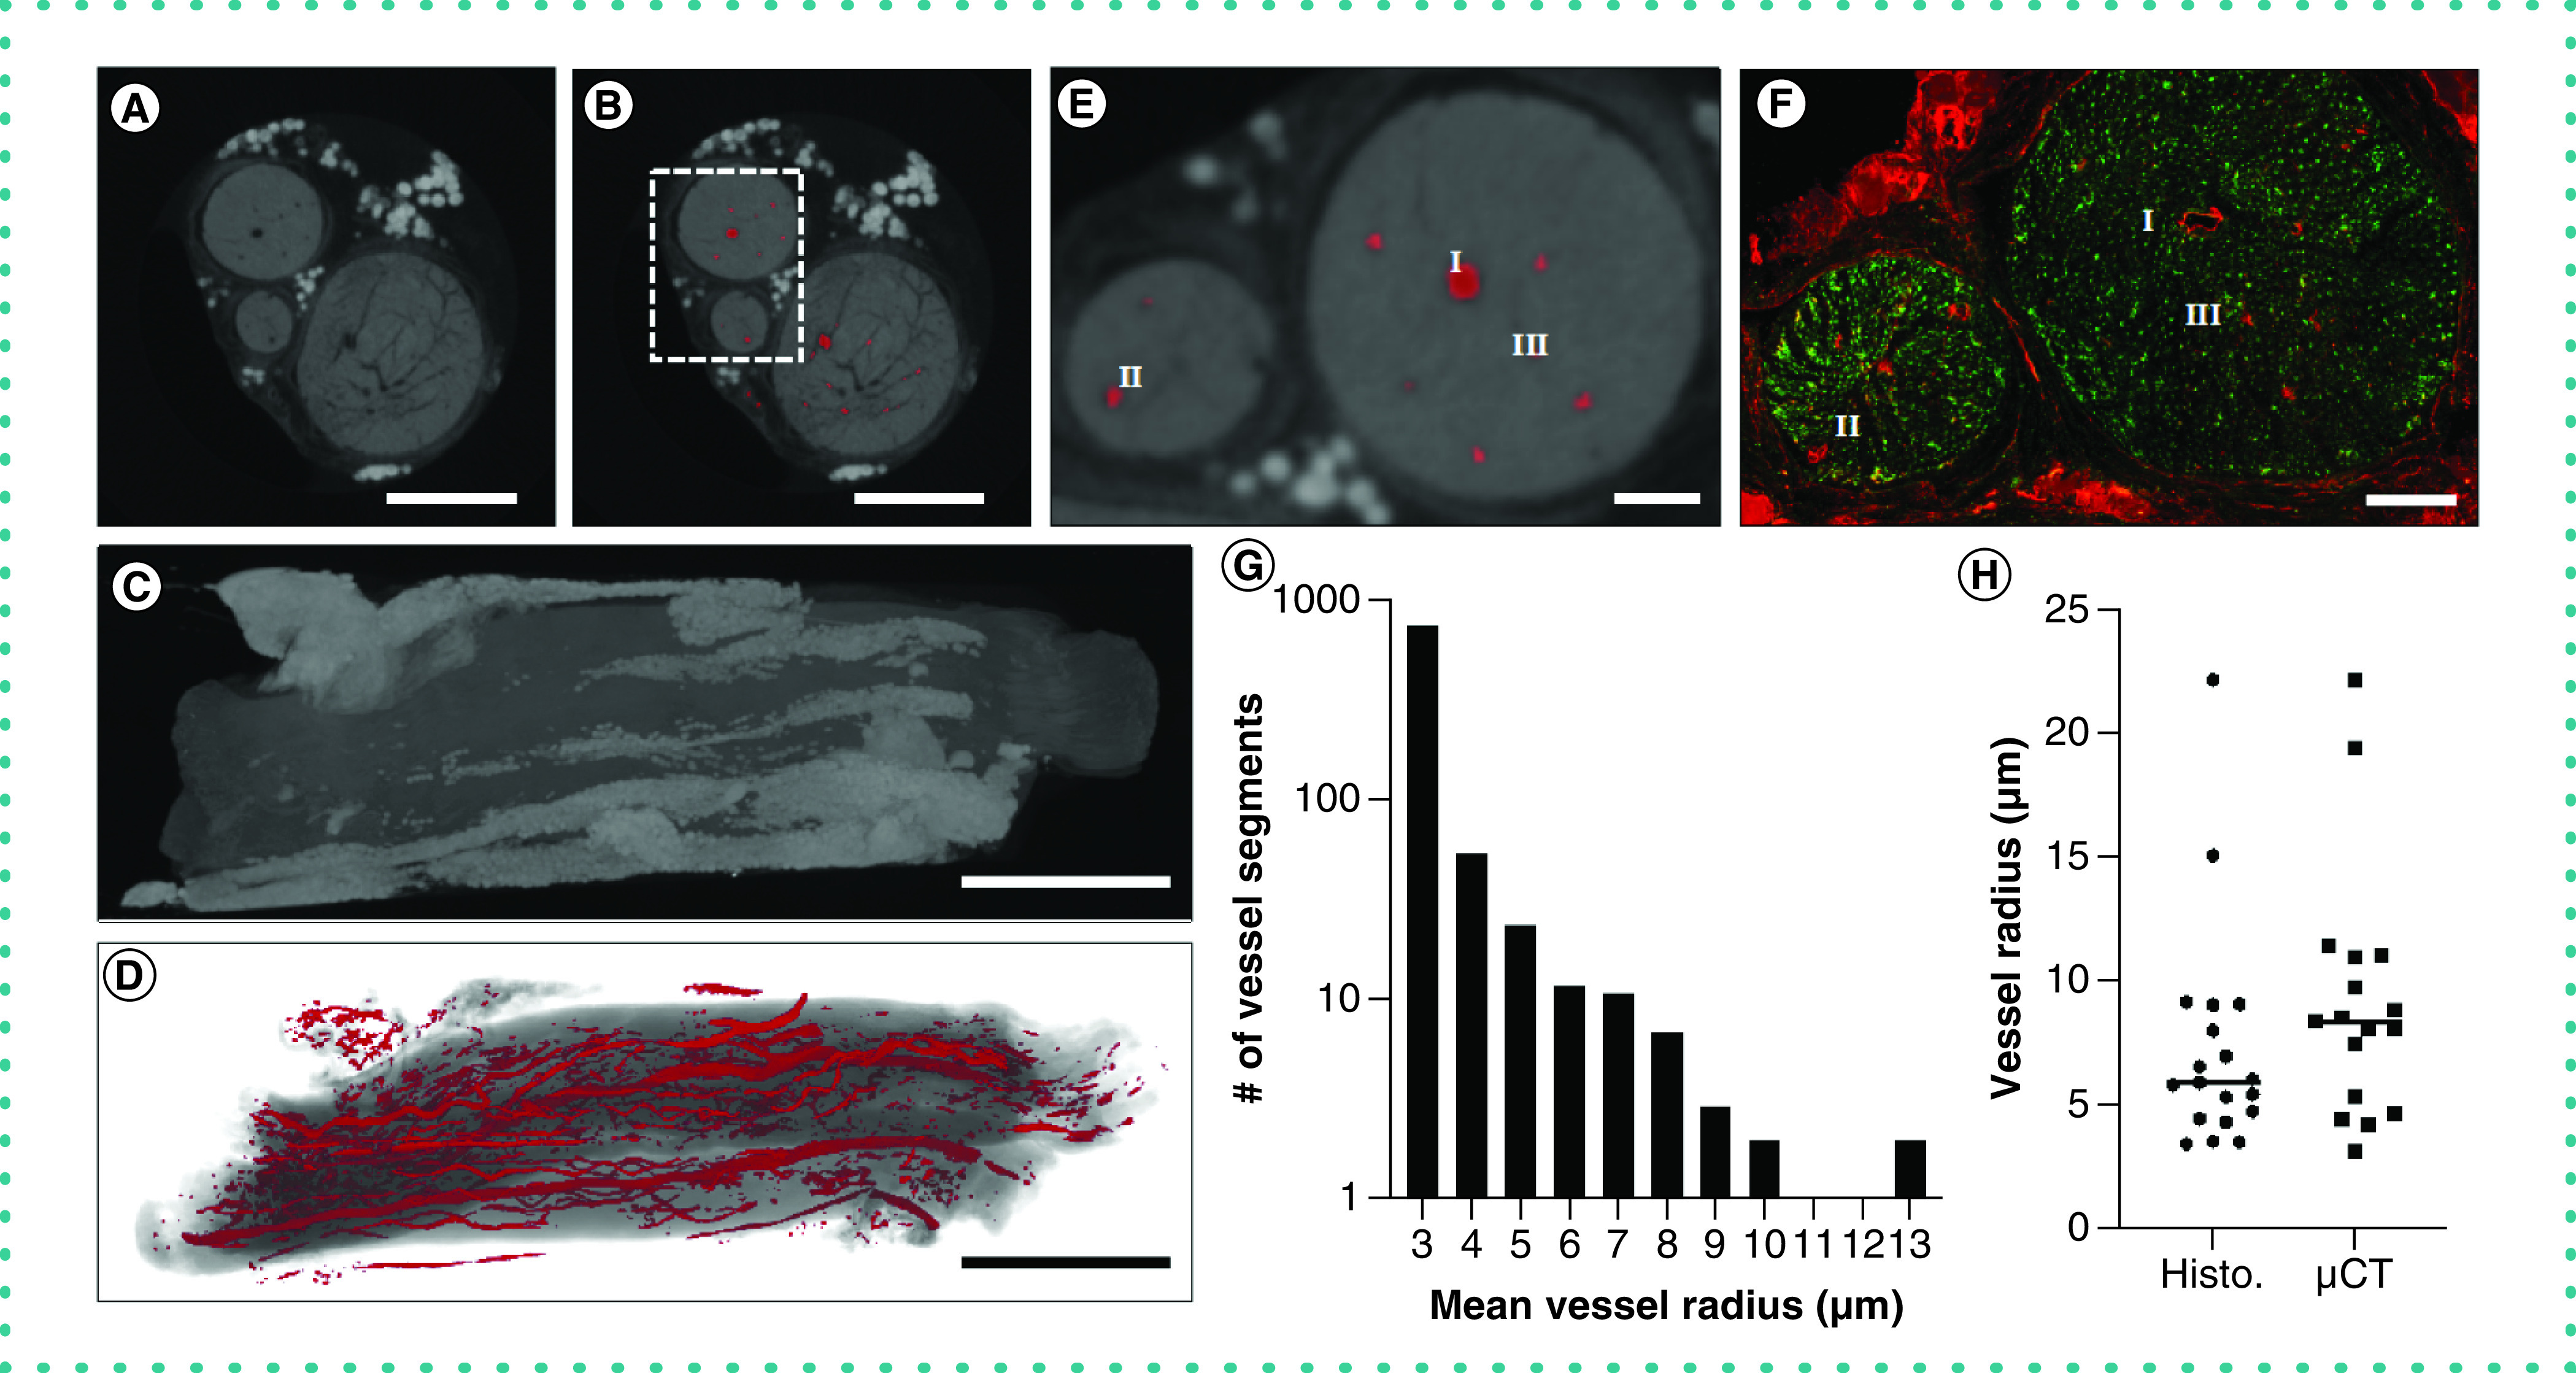
Figure 2. . Application of the staining and segmentation applied to rat sciatic nerves.

(A) The reconstructed microCT images were cropped to a reduced volume. Scale bar = 500 μm. (B) The nerve was then segmented using our convolutional neural network. Scale bar = 500 μm. (C) The maximum intensity projection of the unsegmented microCT stack. Scale bar = 1 mm. (D) The volume rendering of the segmented blood vessels. Scale bar = 1 mm. (E) A close-up of the inset in (B), showing the segmented blood vessels in greater detail. Scale bar = 100 μm. (F) The nerve was subsequently processed for histological analysis and stained for blood vessels (PECAM-1, red) or axons (β-III tubulin, green). I, II and III indicate corresponding regions in (E & F). Scale bar = 100 μm. (G) The frequency of measured radii of microCT-segmented blood vessels shows our technique can segment both vessels at the voxel size limit and larger blood vessels. (H) A measurement of vessel radii on confocal and microCT images revealed no significant difference in vessel radius.
