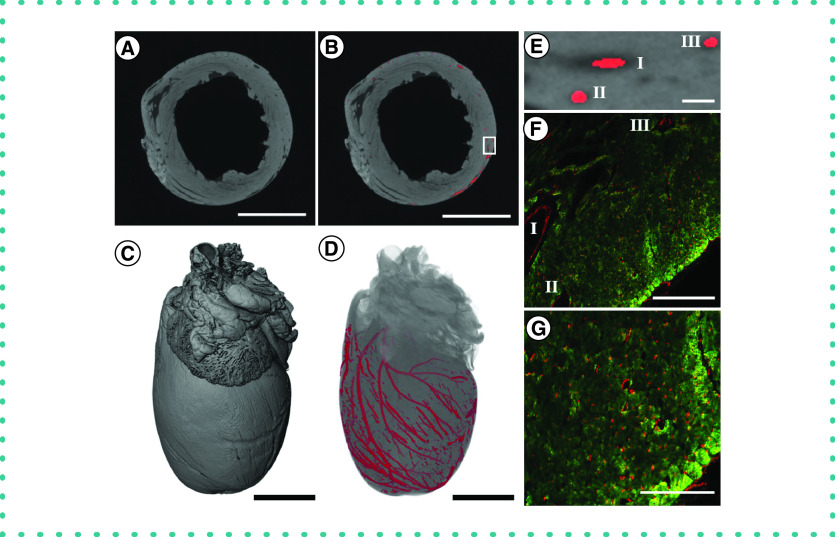
Figure 3. . Application of the staining and segmentation method applied to a rat heart.
(A) The reconstructed microCT images were cropped to a reduced volume. Scale bar = 5 mm. (B) The heart was then segmented using the convolutional neural network. Scale bar = 5 mm. (C) The maximum intensity projection of the unsegmented microCT stack. Scale bar = 2.5 mm. (D) The volume rendering of the segmented blood vessels. Scale bar = 2.5 mm. (E) Higher magnification for inset shown in part (B). Scale bar = 200 μm. (F) Histological sections from the left ventricle of the heart. Immunostaining was performed for cardiac muscle (troponin T, green) and blood vessels (PECAM-1, red). I, II and III indicate corresponding regions in (E & F). Scale bar = 200 μm. (G) A higher-magnification image of the heart tissues, showing the microvasculature. Immunostaining was performed for cardiac muscle (troponin T, green) and blood vessels (PECAM-1, red). Scale bar = 100 μm.

