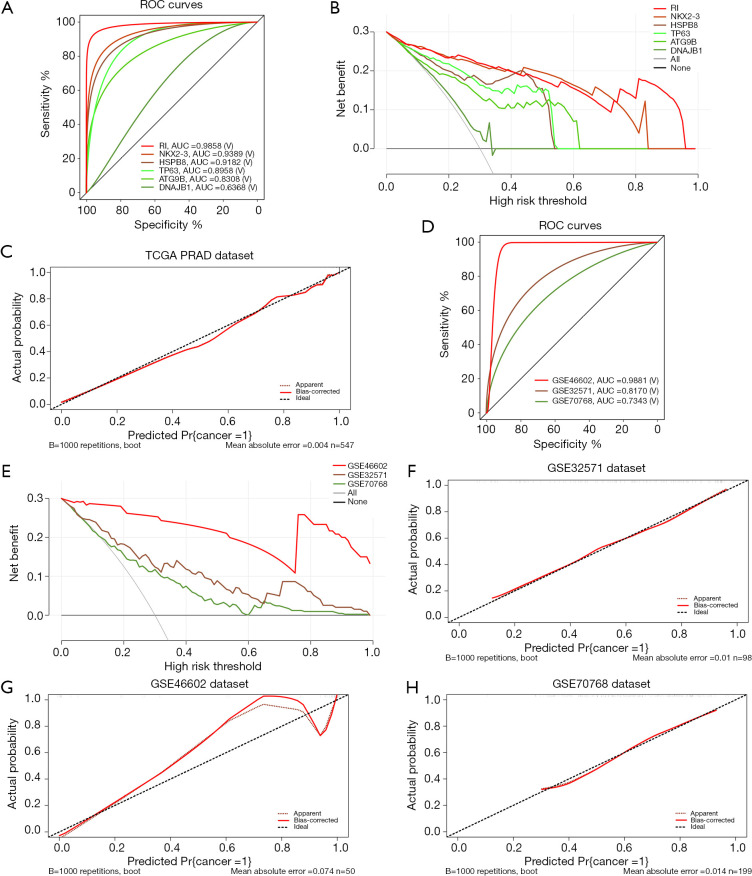
Figure 4.
Assessment and validation of the RI. (A) ROC curves for the 5 independent diagnostic genes (ATG9B, DNAJB1, HSPB8, NKX2-3, TP63) and the RI based on TCGA PRAD dataset. (B) DCA curves for the 5 independent diagnostic genes (ATG9B, DNAJB1, HSPB8, NKX2-3, TP63) and the RI based on TCGA PRAD dataset. (C) Calibration curves of the RI in TCGA PRAD dataset. (D) ROC curves and AUC for the RI based on the 4 datasets (GSE32571, GSE46602 and GSE70768). (E) DCA curves for the RI based on the 3 GEO datasets. (F,G,H) Calibration curves of the RI in GSE 32571, GSE46602 and GSE70768. RI, risk index; TCGA, The Cancer Genome Atlas; PRAD, prostate adenocarcinoma; ROC, receiver operating characteristic; AUC, area under the ROC curve; DCA, decision curve analysis; GEO, Gene Expression Omnibus.

