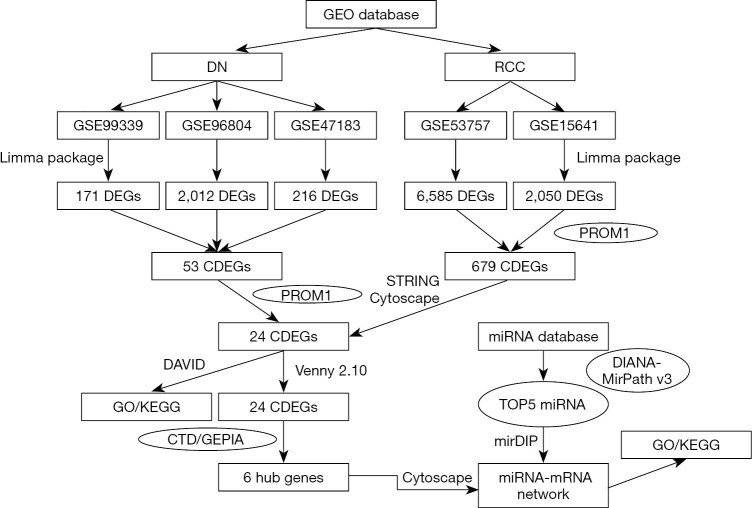
Figure 10.
A flow chart for analysis. GO, gene ontology; KEGG, Kyoto Encyclopedia of Genes and Genomes; DN, diabetic nephropathy; RCC, renal cell carcinoma; CDEGs, co-expressed diferentially expressed genes; CTD, the Comparative Toxicogenomics Database; GEPIA, the Gene Expression Profiling Interactive Analysis.

