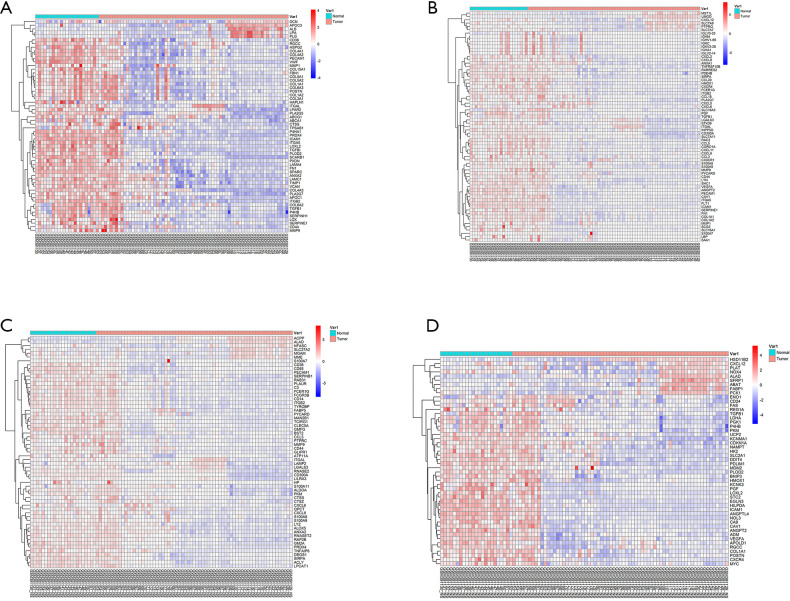
Figure 3.
Hierarchical clustering analysis of RCC-related differentially expressed genes (DEGs). (A) Results of hierarchical clustering analysis for the expression of DEGs in relation to the organization of extracellular structure; (B) results of hierarchical clustering analysis for the expression of DEGs in relation to leukocyte migration; (C) results of hierarchical clustering analysis for the expression of DEGs in relation to neutrophil activation; (D) results of hierarchical clustering analysis for the expression of DEGs in relation to response to oxygen levels. Red, high expression; Blue, low expression. RCC, renal cell carcinoma.

