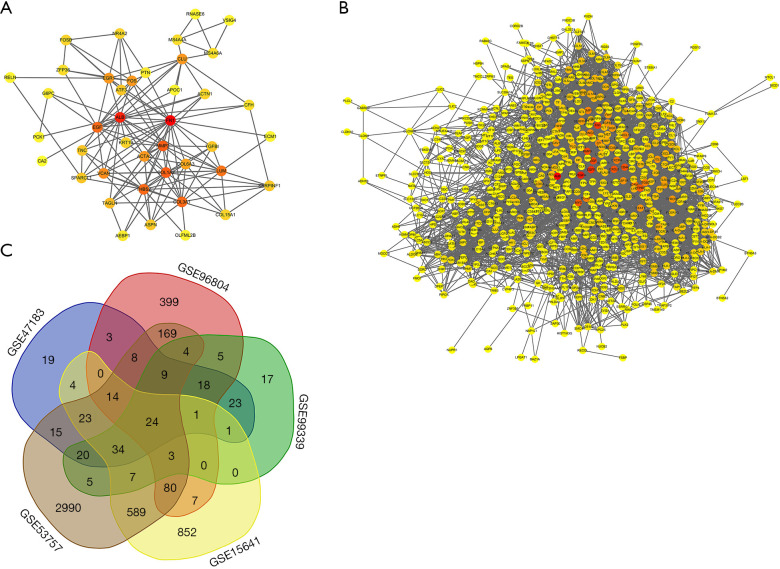
Figure 4.
Protein-protein interaction (PPI) network analysis. (A) PPI network of DN-related DEGs; (B) PPI network of RCC-related DEGs. Red, greater degree; yellow, lesser degree; (C) Venn diagrams of DEGs. PPI network and Venn diagrams: (I) PPI networks of DEGs from A and B constructed using the String database (threshold >0.4); (II) Venn diagrams of DEGs related to DN and RCC, respectively. DN, diabetic nephropathy; DEGs, differentially expressed genes; RCC, renal cell carcinoma.

