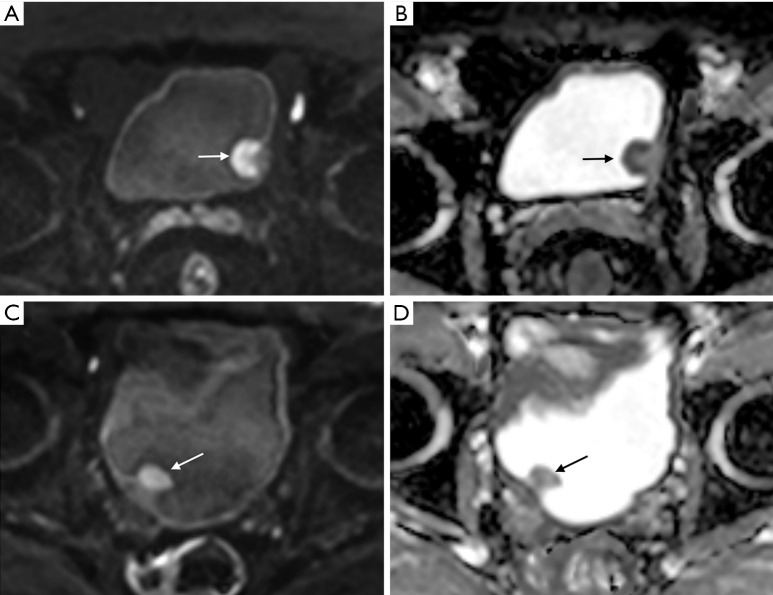
Figure 10.
Correlation of apparent diffusion coefficient (ADC) value and tumor grade. (A,B) Urothelial carcinoma (stage T1) in an 82-year-old man. High b value axial diffusion-weighted magnetic resonance image (A) and apparent diffusion coefficient (ADC) map (B) with an ADC value of 0.9×10⁻³ mm2/s showing a papillary mass (arrow) in the left wall with marked diffusion restriction. This tumor was staged as a high-grade urothelial carcinoma after the histopathological examination of transurethral resection of bladder tumor (TURBT) specimens. (C,D) Urothelial carcinoma (stage Ta) in a 64-year-old man. High b value axial diffusion-weighted magnetic resonance image (C) and ADC map with an ADC value of 1.45×10⁻³ mm2/s (D) showing a papillary mass in right wall with mild to moderate diffusion restriction. The tumor was confirmed as a low-grade urothelial carcinoma on the histopathological examination of TURBT specimens. Both patients underwent diffusion-weighted imaging with the same 3T magnetic resonance imaging equipment (Skyra, Siemens) and parameters; moreover, the window level and width were similar. Although direct comparisons may be inaccurate owing to differences in the cases, a more pronounced diffusion restriction is observed in the diffusion-weighted images of (A) and (B), which were confirmed as high-grade urothelial carcinoma.

