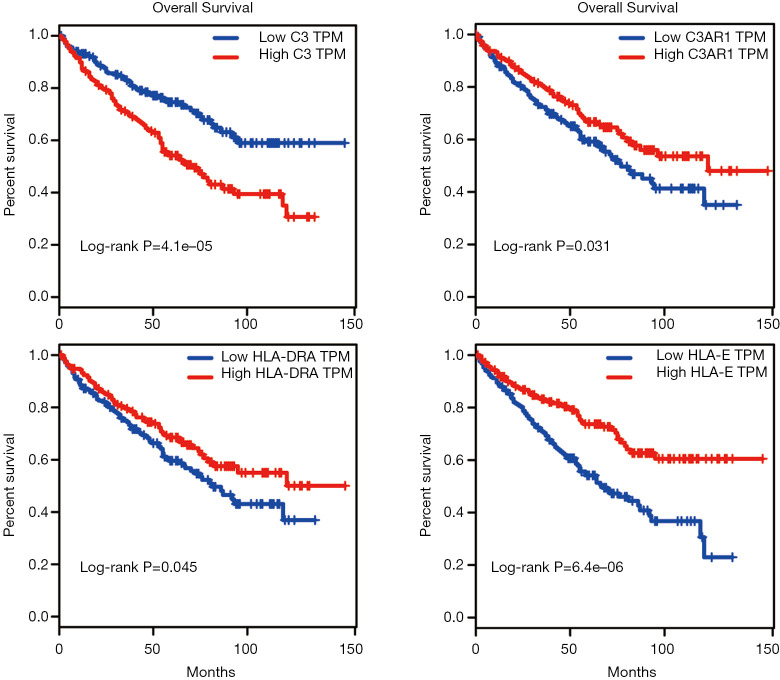
Figure 5.
Survival curves of C3, C3AR1, HLA-DRA, and HLA-E from the GEPIA database. Red represents the high expression group, and blue represents the low expression group. Log-rank P<0.05 for the survival rate between two groups shows a statistically significant difference. GEPIA, Gene Expression Profiling Interactive Analysis.

