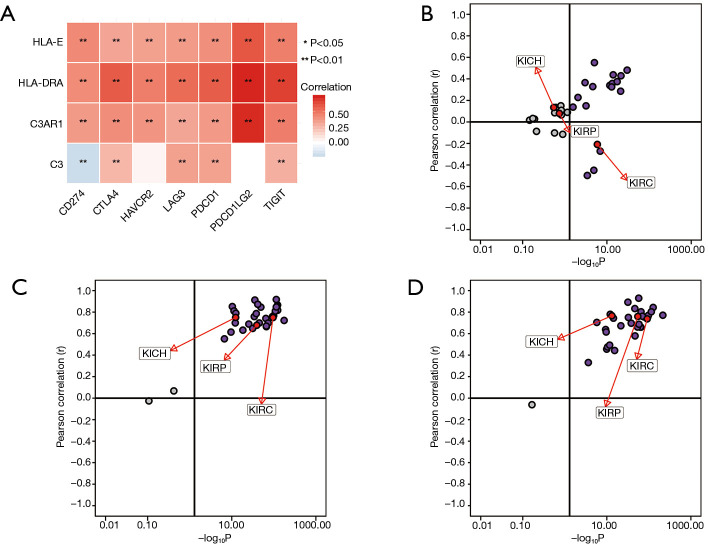
Figure 9.
Association between potential biomarkers and immune-checkpoints. (A) Correlation of four genes and seven immune-checkpoints. Red represents a positive correlation, and blue represents a negative correlation; the darker the color in the heatmap, the higher the correlation between genes. *, P<0.05; **, P<0.01; (B) correlation between C3 and CD274 in 33 types of cancers through the pan-cancer analysis; (C) correlation between C3AR1 and PDCD1LG2 in 33 types of cancers though the pan-cancer analysis; (D) correlation between HLA-DRA and PDCD1LG2 in 33 types of cancers though the pan-cancer analysis.

