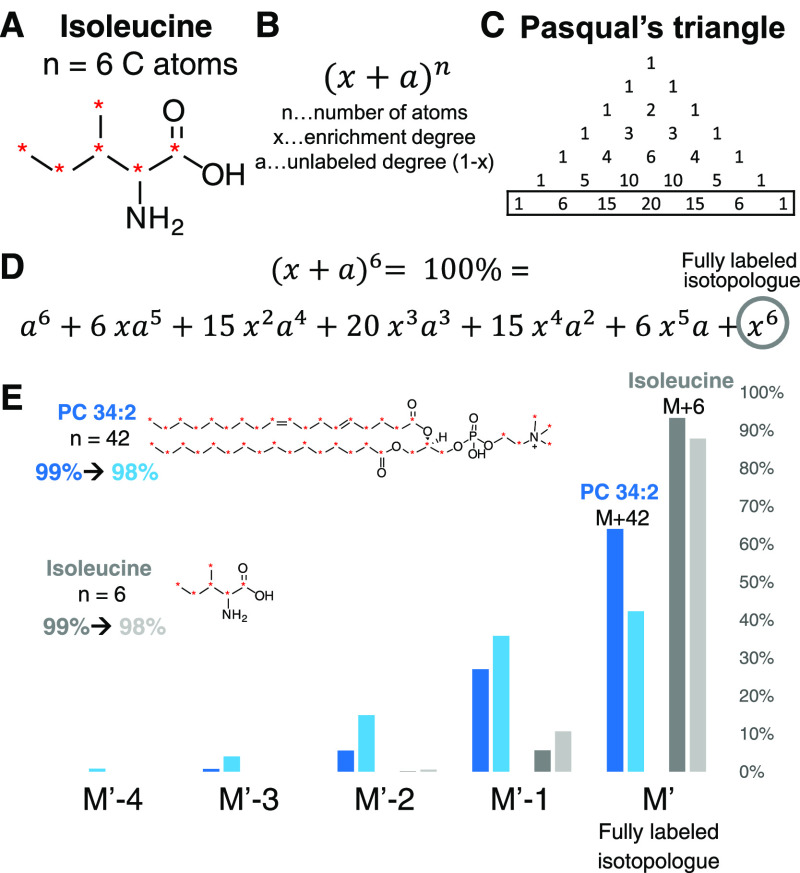
Figure 3.
Difference between enrichment degree and the relative isotopic abundance of a fully labeled isotopologue. (A) Isoleucine with 6 carbon atoms is used as an example. (B) Calculation of abundances for carbon as di-isotopic element is based on the binominal formula. Other elements with more than one isotope (e.g. H, N) influence the final abundance according to their natural abundance also based on a binominal formula. Polyisotopic elements (O) are based on polynomial terms. Usually, the contribution of H, N, and O to the overall difference is minimal (here 1–2%) but other elements must be considered (e.g. Cl, Br, S). (C) Determination of coefficients of a binominal formula for each term according to the n + 1 line in Pasqual’s triangle (for n = 6:1, 6, 15, 20, 15, 6, 1). (D) Binominal formula for n = 6. Each term is the relative abundance of the corresponding isotopologue without the consideration of other elemental isotopes. The last term corresponds to the fully labeled isotopologue. The sum of all isotopologues is always 100%. (E) Exemplarily, the effect of 1% enrichment difference (99%-darker color and 98%-lighter color) on the abundance is shown for PC 34:2 (n = 42, blue) and isoleucine (n = 6, grey). The bar chart shows the distribution from the fully labeled isotopologue (M′) until M′ – 4 for both molecules. The difference for the fully labeled isotopologue to 100% is already 12% for the 98% labeled isoleucine and 58% for PC 34:2. But even for a better enrichment (99%) the error for PC 34:2 is still 36%, highlighting the importance to consider the relative abundance for quantification workflows.50

