Fig. 2.
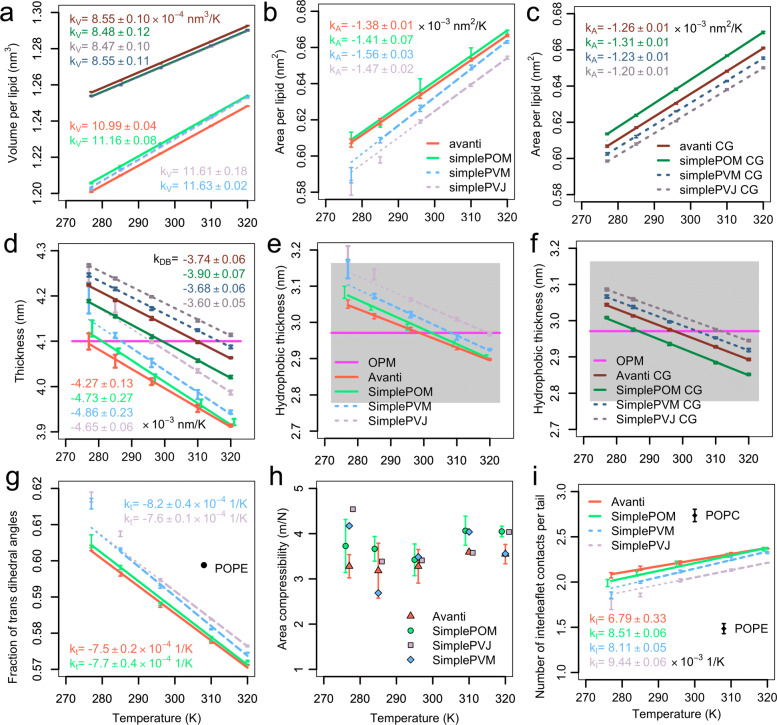
Membrane structural properties. a Volumes per lipid, b areas per lipid in AA systems, and c areas per lipid in CG systems for all models including the volume and area expansivity coefficients. The error bars denote standard deviations over time intervals from all simulations of the given system at the given temperature. The linear fits of the Avanti and SimplePOM models are shown as full lines, whereas the linear fits of the SimplePVM and SimplePVJ models are shown as dashed lines. The SimplePVM AA APL value at 277 K and the APLs of SimplePVJ at 277 K and 285 K were excluded from the fit. The fit extrapolation of the remaining APLs till 277 K is shown as a thin dotted line. d Bilayer thickness and hydrophobic membrane thickness at AA (e) and CG (f) resolution of all investigated systems. For comparison, the experimental bilayer thickness of 4.1 ±0.3 nm [78] as well as the hydrophobic protein thickness of E. coli inner membrane proteins 2.97 ±0.19 nm as extracted from the OPM database [79] are shown as magenta lines. The standard error of the hydrophobic protein thickness from the OPM database is visualized as light gray area. Again, the thickness of SimplePVM at 277 K and SimplePVJ at 277 K and 285 K were excluded from the fit. g Fraction of trans dihedral angles in lipid tails (C2-C16) from all-atom simulations, the values of SimplePVM at 277 K and SimplePVJ at 277 K and 285 K were excluded from the fit. h Membrane area compressibility for all AA systems. The error bars denote standard errors of the mean of the individual simulations. As only a single repetition simulations were performed for test membrane models SimplePVM and SimplePVJ, no error bars are given for these systems. The membrane area compressibility values in case of the SimplePOM membrane were plotted against temperature values shifted by -1 K, and the values of SimplePVJ by 1 K, in order to increase the visibility of the data. i Lipid tail interdigitation quantified as the number of interleaflet contacts per tail for all AA systems and for a pure POPE bilayer at 308 K and a pure POPC bilayer at 300 K. The values of SimplePVM at 277 K and SimplePVJ at 277 K and 285 K were excluded from the fit. The values of the SimplePOM membrane were plotted against temperature values shifted by -1 K in order to increase the visibility of the data

