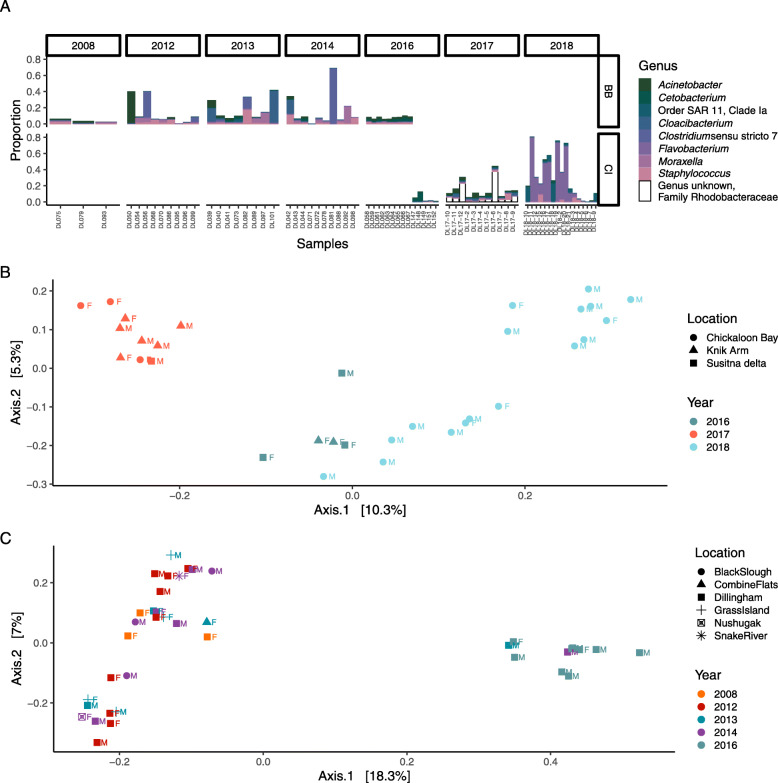
Fig. 3.
Annual variability within each regional population. a Variation in proportional abundance of top 20 ASVs associated with individual whales in Bristol Bay (top row) and Cook Inlet (bottom row), organized by genus. Each bar represents an individual sample, grouped by year along the x-axis. The bottom two plots are PCoA analyses based on Bray-Curtis dissimilarity comparison of epidermal microbiota, with color by year, shape by sampling location, and label by sex, in b Bristol Bay and c Cook Inlet

