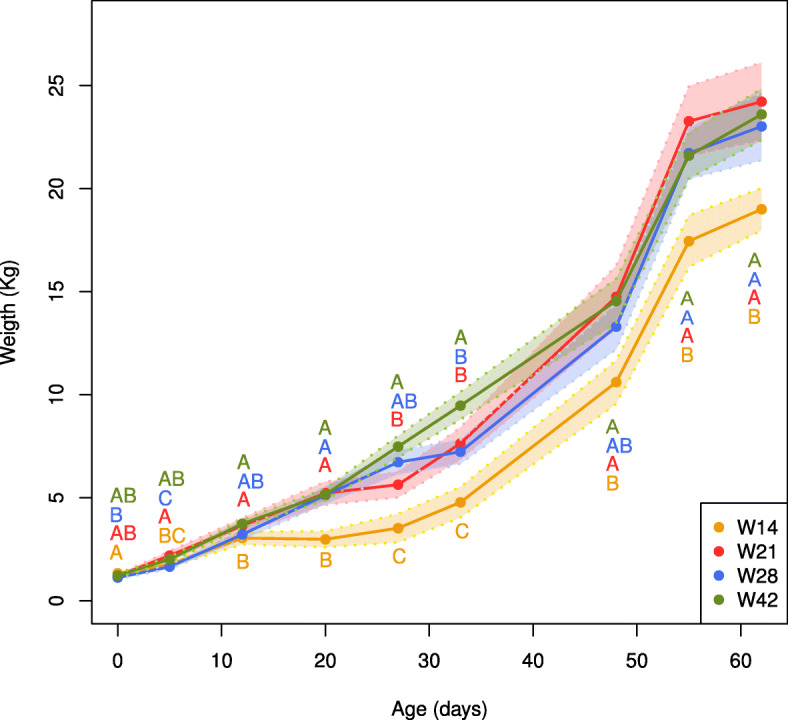
Fig. 1.

Growth curves for piglets weaned at 14 days of age (W14), 21 days of age (W21), 28 days of age (W28), and 42 days of age (W42). The solid and dashed lines show each group’s mean and standard deviation, respectively. The initial sample sizes for each group were as follows: W14: 10 animals, W21: 12 animals, W28: 12 animals, and W42: 10 animals. The samples sizes for each group after weaning were as follows: W14: 4 animals, W21: 6 animals, W28: 6 animals, and W42: 5 animals. Any statistical differences between groups are indicated by different letters in each time point, and further details can be found in Additional file 5: Table S1
