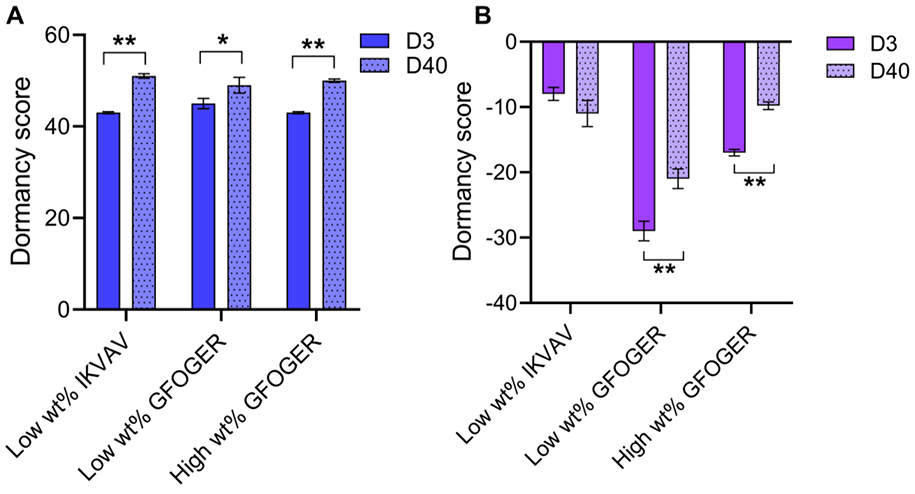
Figure 4. Examination of ‘dormancy score’ for assessing expression of dormancy gene signature in long-term 3D culture.

Next generation sequencing (RNA-seq) was performed on A) T47D (ER+) and B) MDA-MB-231 (TN) in each bioinspired matrix composition at early and late times (day 3 and day 40, respectively) in culture and a dormancy score was calculated with the RNA-seq data. Statistical differences in dormancy score determined with Student’s two-sided t-test, where differences shown are for day 40 time point in comparison to day 3 (*p < 0.05; full set of p-values for other comparisons can be found in Table S4).
