Figure 5.
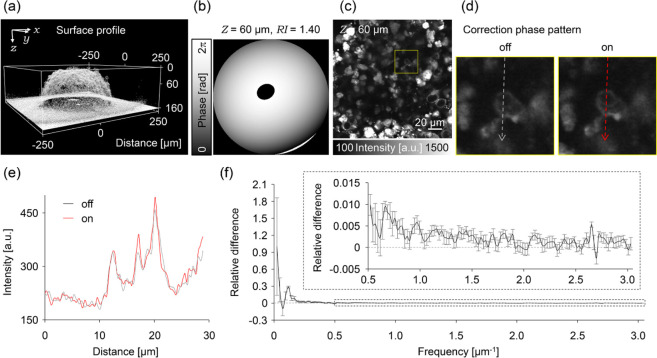
AO corrections in MCTSs. (a) 3D surface profile of the living MCTS visualized by florescent dextran solution. (b) Correction phase pattern with the RI value of 1.40 at 60 μm depth. (c) Image of the inside of the MCTS at the depth of 60 μm observed without applying the correction phase pattern. (d) Magnified image in the yellow square region of the (d) without (left) or with (right) applying the correction phase pattern. (e) Fluorescence intensity profiles in (d). The color of the lines corresponds to those of (d). (f) Normalized relative differences of the spatial frequency spectrum between each of the images obtained with and without applying the correction phase pattern. The differences were averaged in 10 sequential images of z-stack. Inset graph is a magnified view of the spectrum.

