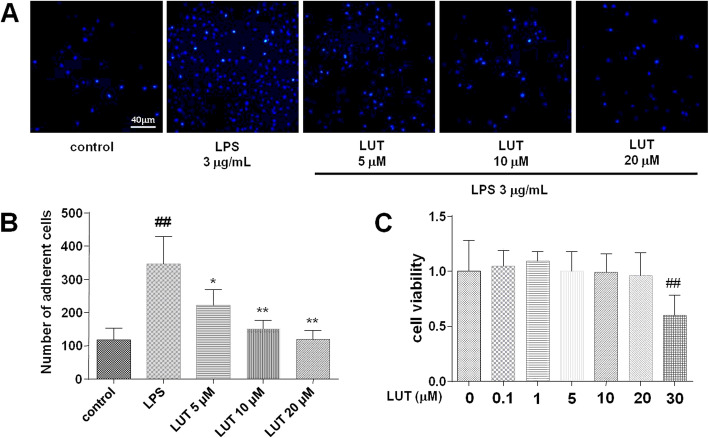
Fig. 2.
The effect of luteolin on LPS-induced cell adhesion between EA.hy926 and THP-1. a Representative images of cell adhesion between EA.hy926 and THP-1. Pictures were captured at 200x magnification. b A quantitative evaluation of adherent cells. The data were expressed as means ± SEM (n = 9). Significant differences were indicated by ##P< 0.01 as compared with the control group, *P< 0.05, **P< 0.01 as compared with the LPS group. c The effect of luteolin on cell viability in EA.hy926. The data were expressed as means ± SEM (n = 12). Significant differences were indicated by ##P< 0.01 as compared with the control group

