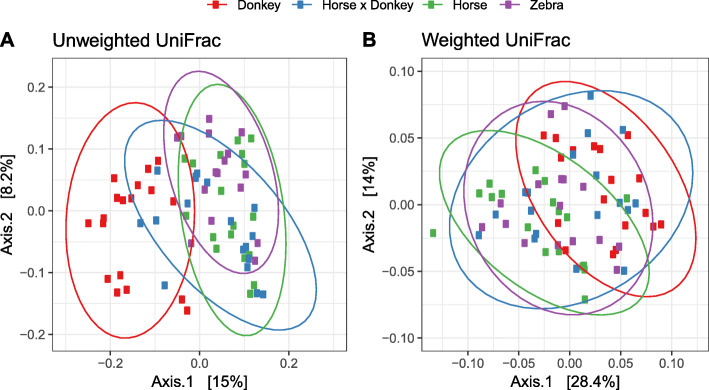
Fig. 2.
Unweighted (a) and weighted (b) UniFrac based principal co-ordinates analysis of the fecal prokaryotic community composition of the different equine types at the OTU level. Analysis used Log10 transformed data with ellipses representing 95% confidence intervals, and the percentages values labelled on each axis indicating the amount of total variation represented.

