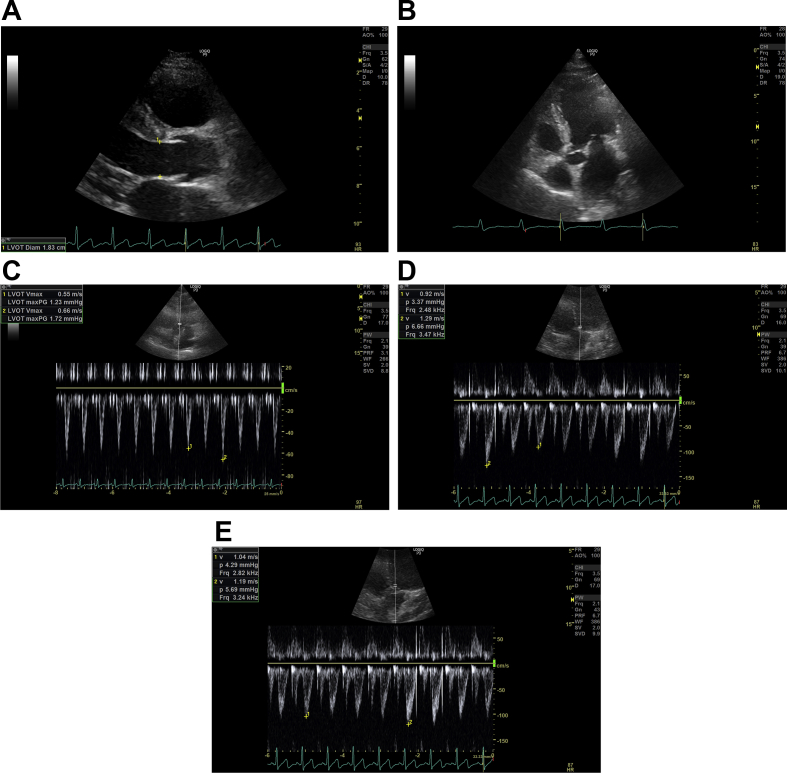
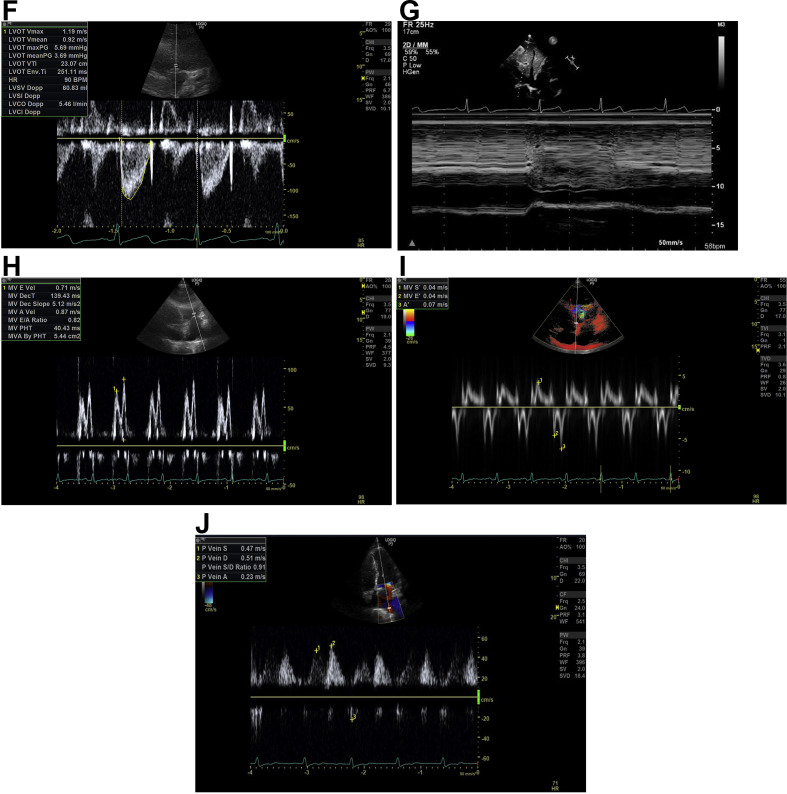
Fig 2.
(A) Left ventricular outflow tract (LVOT) diameter. Parasternal long axis view is found by placing the probe to the left of the sternum, perpendicular to the chest, in the third or fourth intercostal space with the indicator of the probe pointing at the 11 o'clock position. By zooming into the LVOT tract, the image is frozen in systole whilst the aortic cusps are fully opened; the LVOT diameter is measured about 0.5 cm back from the aortic valve cusp insertion points on the ventricular side. The LVOT diameter is measured inner edge to inner edge at the widest diameter. (B) LVOT Apical 5 chamber (A5C) view. This view is obtained by placing the probe in the mid-axillary line, fifth intercostal space, with the indicator of the probe pointing at the 3 o'clock position. The probe is tilted up slightly anteriorly to visualise the left ventricular aortic outflow tract. The Doppler cursor with the pulsed wave (PW) Doppler sample volume is placed at the level of the aortic valve annulus within 15° to the LVOT. (C) LVOT velocity: non-fluid-responsive state. Aortic blood flow can be recorded using PW Doppler across the LVOT in the A5C view. The normal horizontal sweep speed is 100 mm s−1, the sweep speed is increased to ensure several respiratory cycles are represented and the image is frozen. LVOT maximum velocity variation during the respiratory cycle on inspiration and expiration can be measured. The LVOT velocity variation with respiration here is 17% (<20%), suggesting a non-fluid-responsive state. (D) LVOT variation: fluid-responsive state. This is the A5C view with the PW Doppler recording across the LVOT. The normal horizontal sweep speed is 100 mm s−1, the sweep speed is increased to ensure several respiratory cycles are represented and the image is frozen. The beat-to-beat variation in LVOT maximum velocity can be measured. Here, before a fluid challenge, the beat-to-beat variation in LVOT maximum velocity is 28% (>12%), suggesting a fluid-responsive state. (E) Effect of a fluid challenge: non-fluid-responsive state. This is the A5C view with the PW Doppler recording across the LVOT. The normal horizontal sweep speed is 100 mm s−1, the sweep speed is increased to ensure several respiratory cycles are represented and the image is frozen. The beat-to-beat variation in LVOT maximum velocity can be measured. Here the PW Doppler across the LVOT after a fluid challenge can be seen and the beat-to-beat variation in LVOT maximum velocity is 12% suggesting a non-fluid-responsive state. (F) LVOT velocity-time integral (VTI). As before, the aortic blood flow can be recorded using PW Doppler trace across the LVOT. The normal horizontal sweep speed is 100 mm s−1, the sweep speed is reduced, the recording frozen and the envelope is traced. The machine computes the area under the curve which is the VTI in cm. The LV stroke volume can be calculated from the VTI. Repeat VTI measurements on three to five consecutive beats to calculate and averaged stroke volume. For stroke volume variation, increase the sweep speed and trace the maximum and minimum VTI over one respiratory cycle. (G) Inferior vena cava (IVC): fluid-responsive state. The subcostal view is obtained, with the patient lying flat. To visualise the IVC vessel in its long axis the probe is rotated counter-clockwise moving the indicator from the 3 to 12 o'clock position. The M mode is activated through the IVC just distal to the hepatic vein and the image frozen. The respiratory waveform (green) can be used to measure the IVC diameter during inspiration and expiration. Here the IVC distensibility index is 60% (i.e. >18%), suggesting a fluid-responsive state. (H) Mitral inflow. In the apical four chamber (A4C) view, PW Doppler can be used to evaluate the MV inflow. The PW Doppler sample volume is placed at the tips of the mitral valve leaflets, and a PW trace is obtained. The Peak E wave velocity (the first peaking of velocity in early diastole) and the Peak A wave velocity (the second peak representing the end-diastolic atrial contraction) are measured. E-A fusion as seen here is often seen with tachycardia. The E/A ratio is automatically calculated by the machine. (I) Tissue Doppler imaging (TDI). In the A4C view, TDI can be activated and the PW Doppler sample volume is placed across the medial mitral annulus to obtain the septal e′. Similarly, a PW Doppler sample volume should be placed across the lateral mitral annulus to obtain the lateral e′. The septal and lateral e′ are averaged to represent the early myocardial velocity (the myocardium moving away from the transducer) which corresponds to early diastolic relaxation. The E wave from Figure 2H is 0.71 m s−1 giving an E/e′ of 18 (>13), suggesting high left ventricular end-diastolic pressure. (J) Pulmonary vein. In the A4C view, the PW Doppler sample volume is placed inside a pulmonary vein to examine pulmonary venous flow. There are three components: the S wave represents forward flow into the left atrium during ventricular systole, the smaller D wave represents forward flow during ventricular diastole and the A wave represents flow reversal in the pulmonary vein during atrial systole. Here, the D wave is bigger than the S wave and the S/D ratio is 0.9, suggesting high left ventricular end-diastolic pressure.


