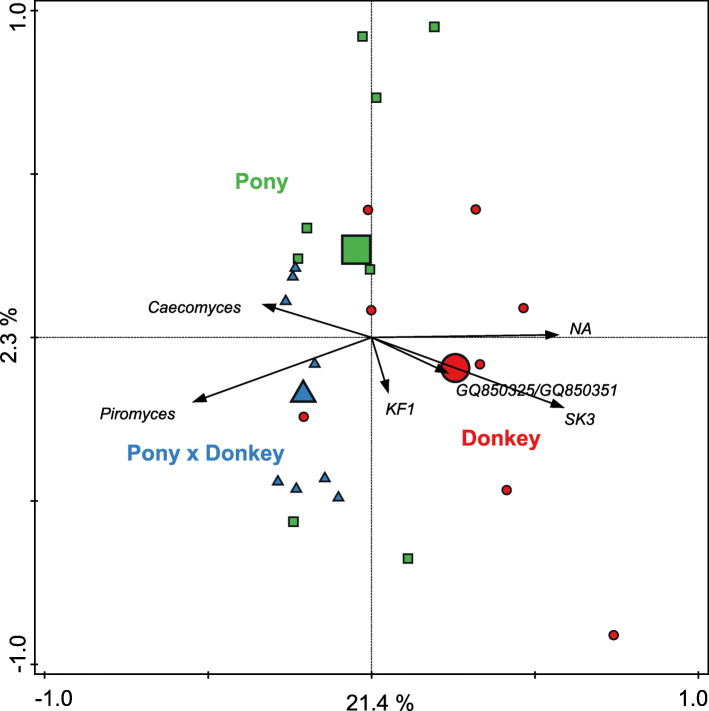
Fig. 5.
Redundancy analysis triplot showing the relationship between the anaerobic fungal genus-level phylogenetic groupings of the OTUs for which the variation is best explained by the constrained axes. Arrow length indicates the variance that can be explained by equine type, with the perpendicular distance of the equine types to the arrow indicating the relative abundance of the genus-level phylogenetic grouping. Arrow labels indicate the taxonomic affiliation that the genera could be reliably assigned to. For example, ‘g_SK3’ represents a grouping reliably assigned to the SK3 genus, whereas ‘NA’ indicates that it was reliably assigned to the family Neocallimastigaceae but the genus could not be annotated. Equine type means (large symbols) and individual samples (small symbols) are coded by equine type: donkey (red circle), pony (green square) and pony × donkey (blue triangle). Equine type explained 23.6% of the total variation in the dataset, and the plot axes are labelled with the amount of variation they represent

