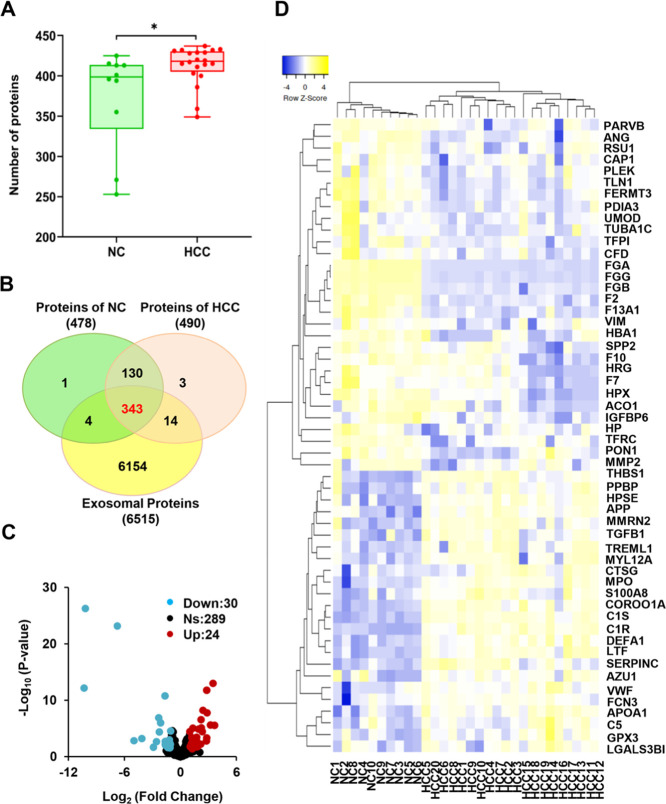
Figure 2.
DEPs as an indicator for the classification of the samples. (A) The box plot showed a significant difference in the number of proteins between NC (n = 10) and HCC (n = 20). (B) Venn diagrams of 343 coidentified exosomal proteins of NC and HCC, and 6515 human exosomal proteins from the ExoCarta database. (C) The volcano plot for DEPs. Blue dots represent the downregulated exosomal proteins, grey dots represent exosomal proteins that are not significantly expressed, and the red dots represent the upregulated exosomal proteins. (D) The clustered heat map of 54 DEPs. The exosomal proteins were grouped into four clusters according to the Euclidian distance. Upregulated and downregulated exosomal proteins completely separated the samples into HCC and NC, respectively.

