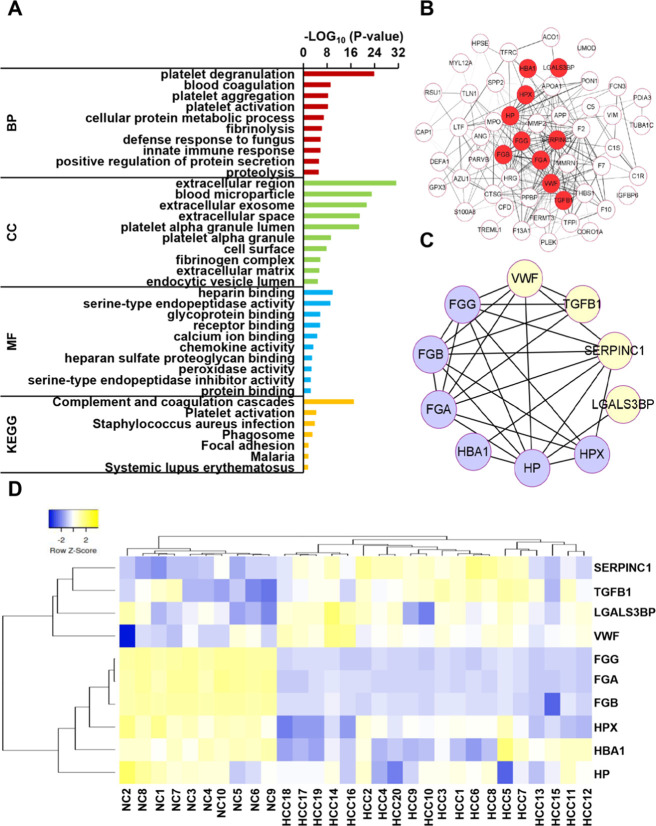
Figure 3.
Bioinformatic analysis of the DEPs of HCC. (A) GO and KEGG analyses for DEPs. The p-value of each enrichment entry was represented by the x-axis. (B) Visualization of the protein–protein interaction (PPI) network with DEPs. The red central nodes represented 10 candidate biomarkers. (C) Visualization of the PPI network with the 10 potential candidate biomarkers of HCC. (D) The clustered heat map for the 10 potential candidate biomarkers of HCC.

