
Figure 1.
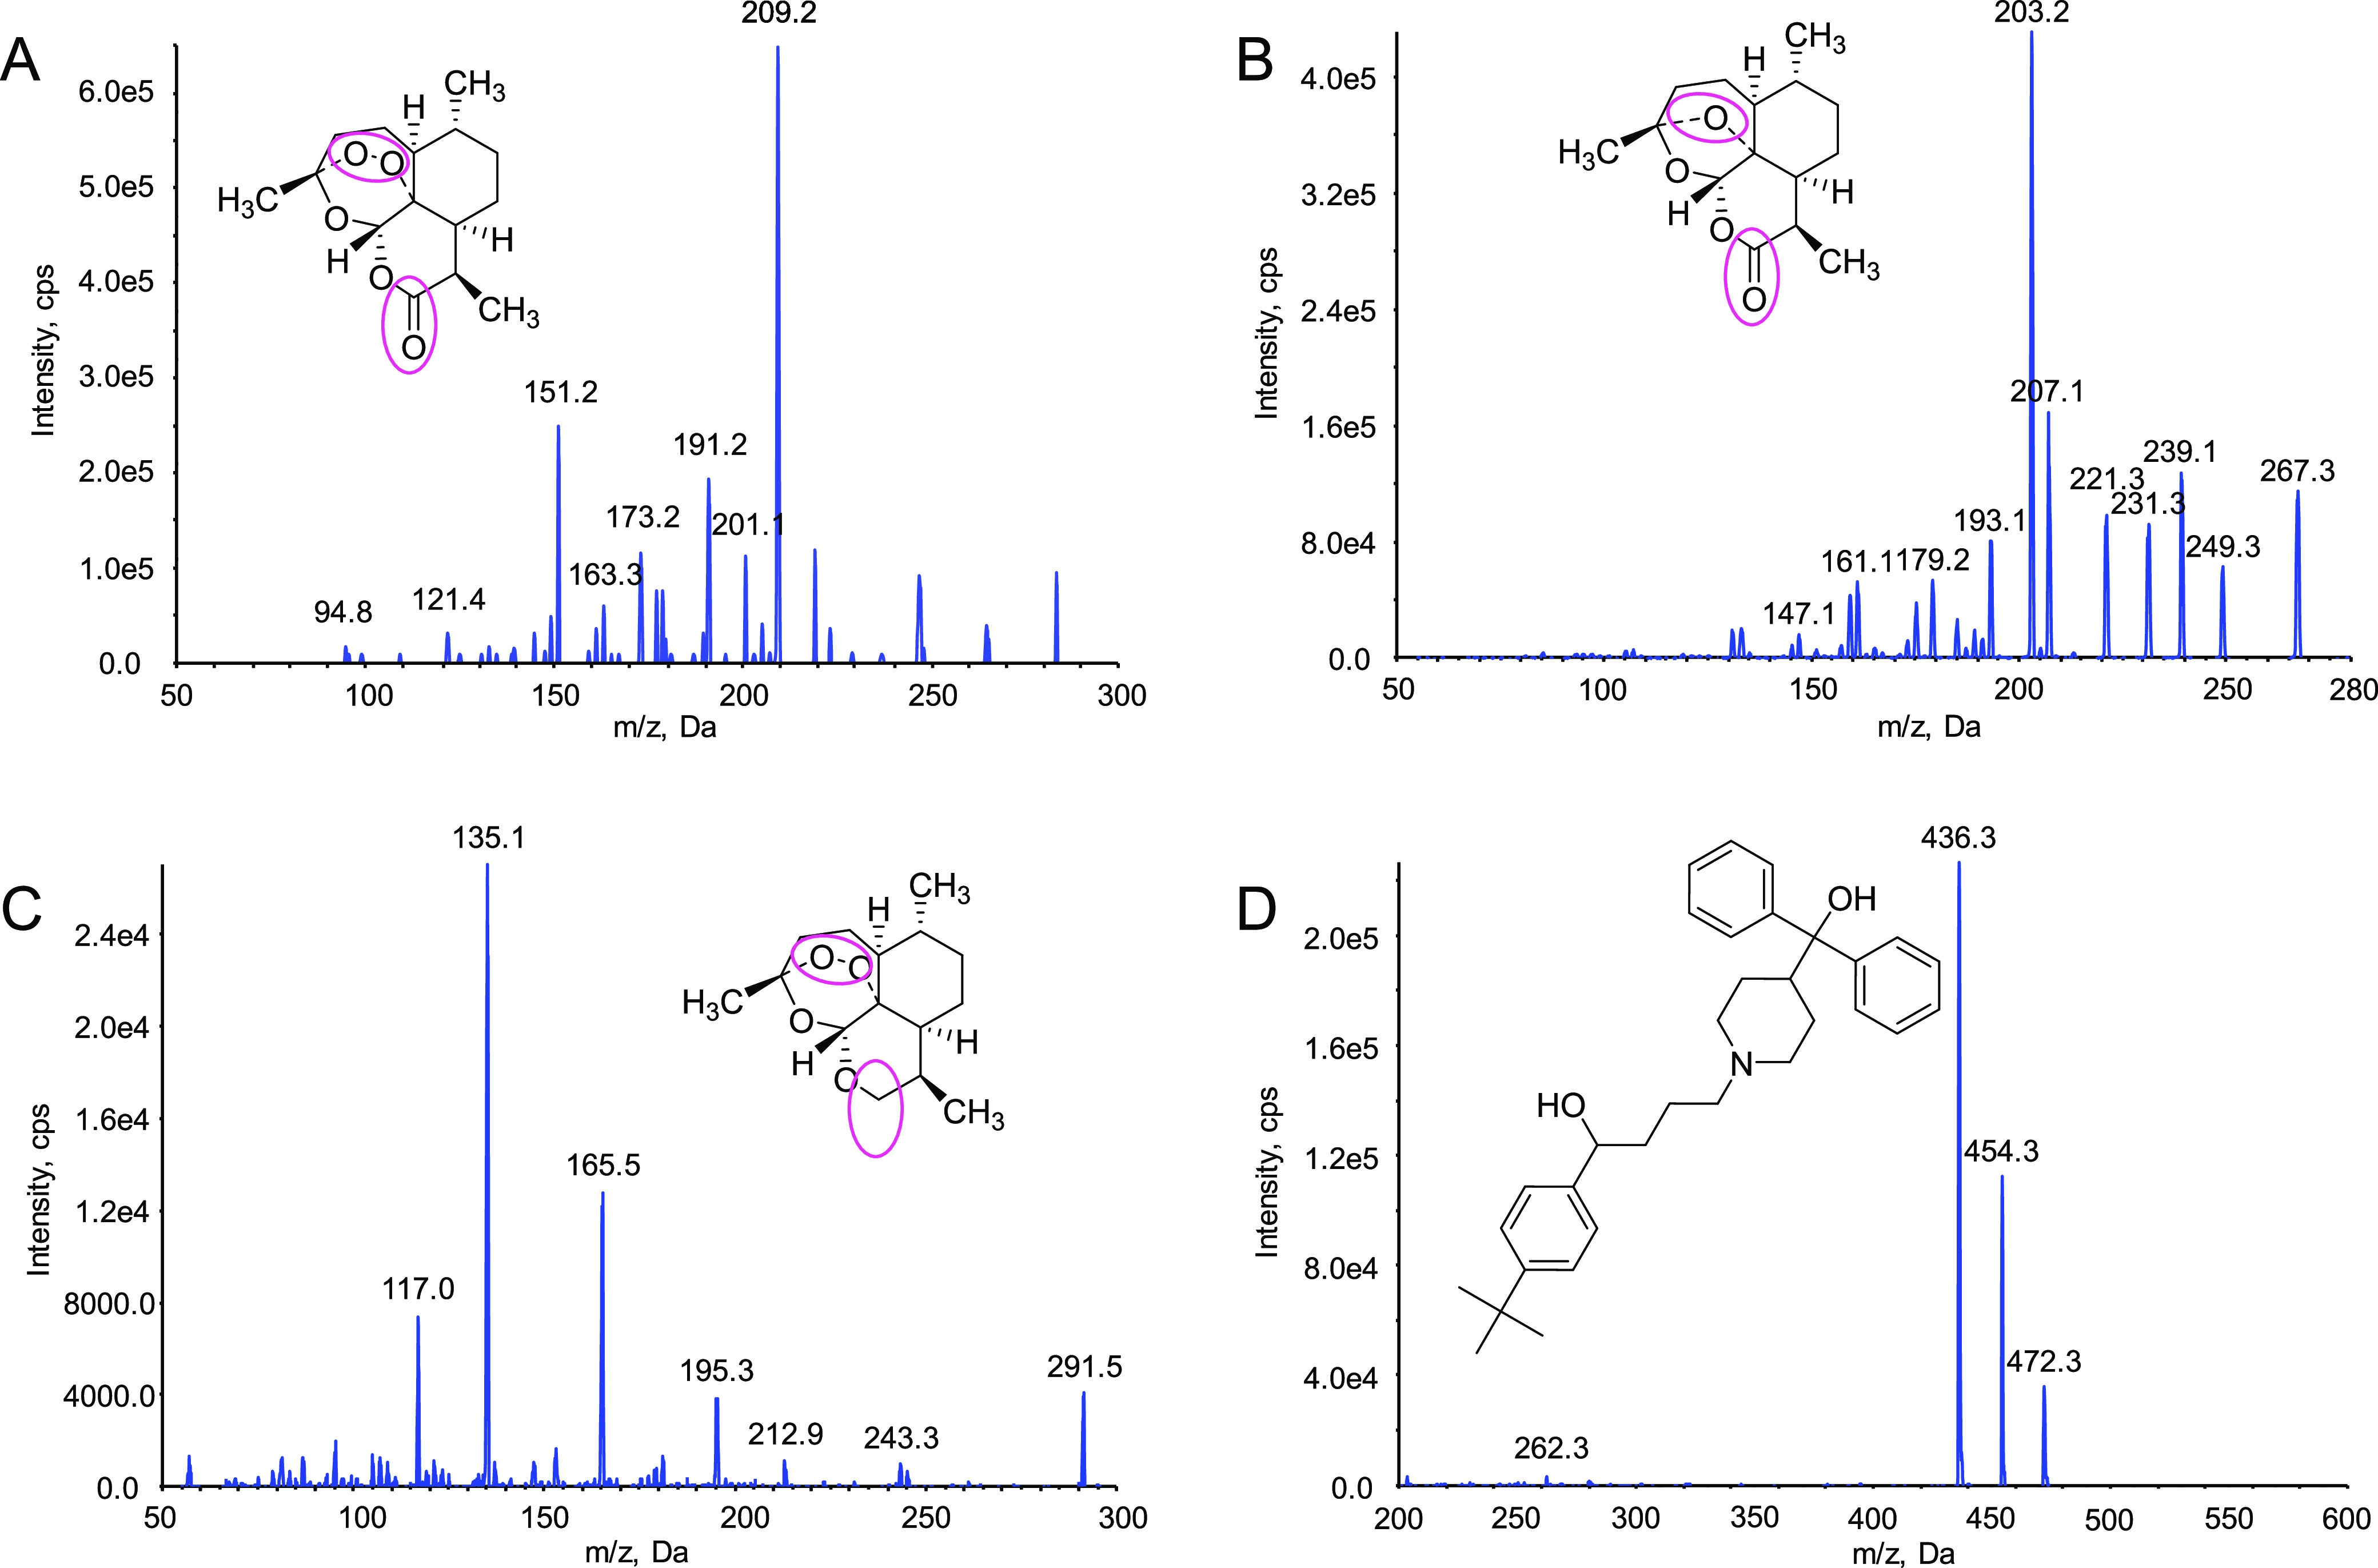
Chemical structures and product ion mass spectra of target compounds. The positions marked with colored circles indicated differences in the structure of the three compounds. (A) Artemisinin, (B) deoxyartemisinin, (C) 10-deoxoartemisinin, and (D) terfenadine.