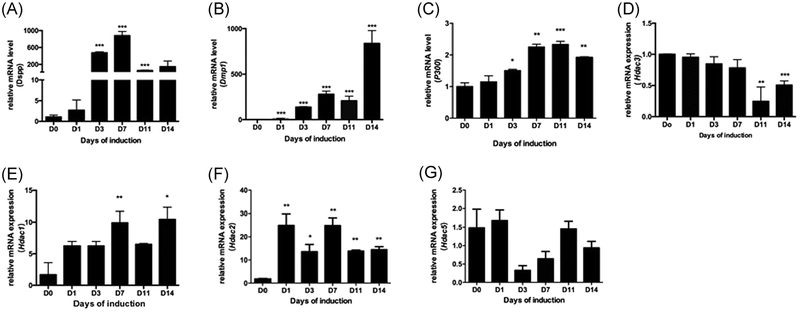
FIGURE 4.
Expression pattern of Hdac3 and p300 during odontoblast differentiation of the mDPCs. mDPCs were cultured with odontoblast differentiation medium over 14 days. mRNAs were prepared on days 0, 1, 3, 7, 11, and 14 after induction. qRT-PCR was performed to detect the expression levels of Dspp (A) and Dmp1 (B), p300 (C) and Hdac3 (D), GAPDH was used as the internal reference. E-G, The expression pattern of HDAC family members were detected. The D0 group was set as the control. All data were presented as mean ± standard deviation (SD) and were based on three independent experiments. GAPDH, glyceraldehyde 3-phosphate dehydrogenase; mDPCs, mouse dental papilla mesenchymal cells; mRNA, messenger RNA; qRT-PCR, quantitative reverse transcriptase polymerase chain reaction. *P < .05, **P < .01, ***P < .001

