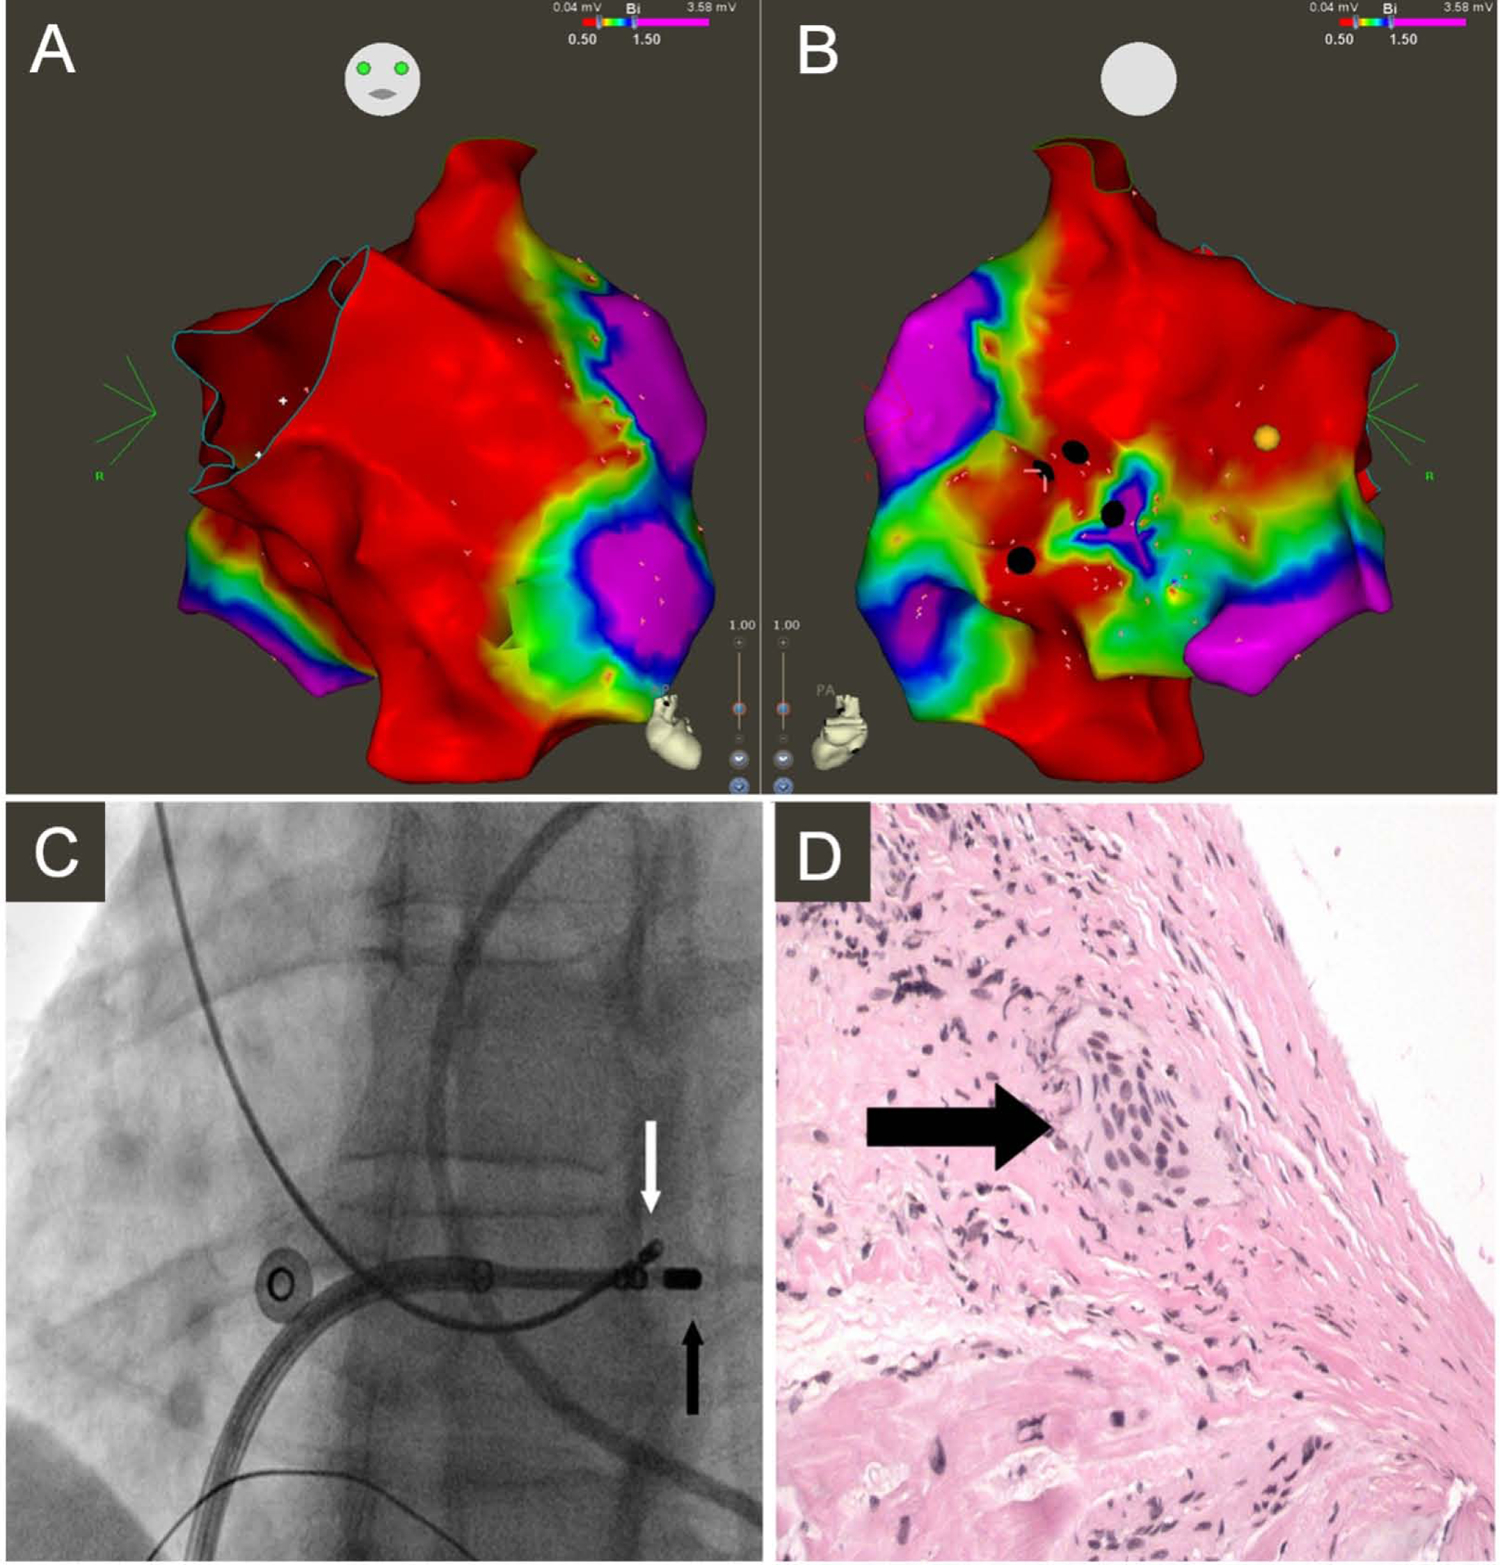
Figure 3: Electrophysiological-guided biopsy of the RV.

Electroanatomic bipolar voltage map of the RV displaying anterior (A) and posterior (B) views. Green, yellow, and red indicate low-voltage regions; purple denotes regions of normal voltage, defined as ≥ 1.5 mV. Black circles illustrate areas targeted for biopsy. Yellow circle illustrates location of right bundle. (C) Fluoroscopy images obtained in the left anterior oblique 25° projection showing bioptome (white arrow) targeting the low-voltage region in the RV septum, adjacent to mapping catheter (black arrow). (D) Microscopic view of an endomyocardial biopsy specimen obtained from the right ventricular septum showing noncaseating granuloma (arrow) (reproduced from(85)).
