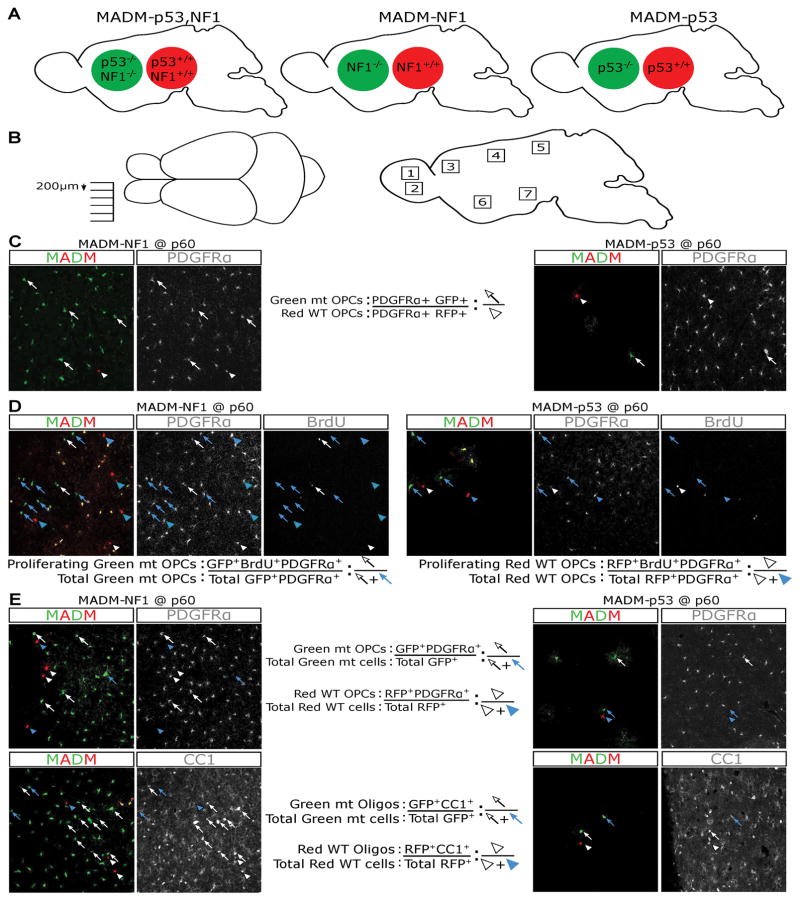
Fig. 2. MADM models used in this study and systematic sampling schemes and quantification methods for determining the effects of NF1 or p53 deletion in vivo.
(A) Simplified schematic to show MADM-p53,NF1 tumor model, MADM-p53 and MADM-NF1 models. GFP+ cells are null for specified genes while RFP+ cells are WT.
(B) To ensure systematic sampling, brains were cut mediolaterally and sections were collected every 200 μm. Seven sections were collected for each sample. Within each brain section, 7 distinct regions (dorsal and ventral olfactory bulb; anterior, middle, and posterior cortex; ventral striatum; hypothalamus) were imaged for quantifications to avoid biases due to potential regional heterogeneity of OPCs.
(C) To evaluate the extent of mutant OPC expansion (G/R ratio in Figure 2A), the total number of mutant OPCs (GFP+ PDGFRα+) and WT OPCs (RFP+ PDGFRα+) were counted and the sum of all 49 areas (7 sections per brain, 7 regions per section) was used to calculate the G/R ratio in each brain. Arrows point to mutant OPCs, and arrowheads point to WT OPCs.
(D) To assess the proliferative rate of OPCs, the total number of proliferating mutant OPCs (BrdU+, GFP+, PDGFRα+) was divided by the total number of mutant OPCs (GFP+ PDGFRα+); and an equivalent scheme was used for WT OPCs. The sum of all 49 areas was used to calculate the final percentage of proliferating OPCs in each populations. Arrows point to mutant OPCs, and arrowheads point to WT OPCs. Blue: non-proliferating OPCs; white: proliferating OPCs.
(E) To assess the differentiation potential of OPCs (the proportion of OPCs versus oligodendrocytes), brains were stained for either PDGFRα or CC-1. The total number of GFP+ PDGFRα+ cells was counted and divided by the total GFP+ cells to determine the relative proportion of OPCs within the mutant population; and an equivalent scheme was used to quantify the WT population. CC1 was used to determine the proportion of oligodendrocytes within both the WT and mutant populations with the same scheme. The sum of all 49 areas was used to calculate the final numbers. Arrows point to mutant OPCs, and arrowheads point to WT OPCs. Blue: OPCs; white: oligodendrocytes.

