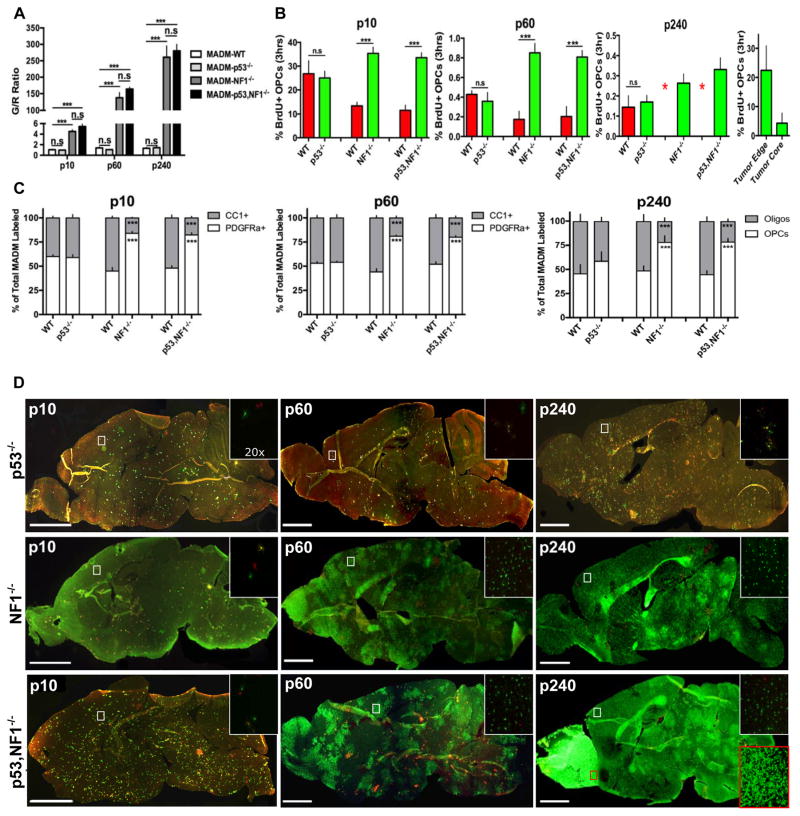
Fig. 3. Loss of NF1 but not p53 is sufficient for over-expansion, increased proliferation and hindered differentiation of mutant OPCs.
(A) Following the individual loss of either NF1 or p53, MADM labeled cells were quantified for the mutant to WT ratio (G/R ratio) at early (P10), pre-transforming (P60) and tumor stages (P240). The loss of NF1 led to massive over-expansion of mutant OPCs comparable to p53-null, NF1-null OPCs at all ages examined, but the loss of p53 had no effects. (n=10) 1-way ANOVA with Dunnett tests; Error Bar ± SEM (*** P < 0.001).
(B) Following the individual loss of either NF1 or p53, the proliferative rate of MADM labeled cells was assessed at P10, P60 and P240. The loss of NF1 led to increased proliferation of mutant OPCs comparable to p53-null, NF1-null OPCs but the loss of p53 had no effects. At P240 WT OPC numbers were too low in MADM-NF1 and MADM-p53,NF1 models for the accurate quantification of proliferative rate (marked as red asterisks). Right panel: tumor cells at the edge of tumor mass showed comparable proliferative rate as perinatal OPCs. 2-way fixed effects ANOVA with replication; Error Bar ± SEM (*** P < 0.001, ** P < 0.01)
(C) Following the individual loss of either NF1 or p53, the relatively proportion of OPCs and oligodendrocytes among MADM-labeled cells were quantified at P10, P60 and P240. The loss of NF1 but not p53 was sufficient for the hindrance in OPC differentiation at all ages examined. 2-way fixed effects ANOVA with replication; Error Bar ± SEM (*** P < 0.001, ** P < 0.01)
(D) Individual loss of either p53 or NF1 alone was not sufficient for gliomagenesis even though NF1 loss led to massive expansion of cell number, increased proliferative rate, and hindered differentiation of OPCs. Insets show higher magnification images of boxed brain region. The red inset in the bottom right panel shows the tumor region in the MADM-p53,NF1 model.
Scale bar 2mm; Inset 50μm

