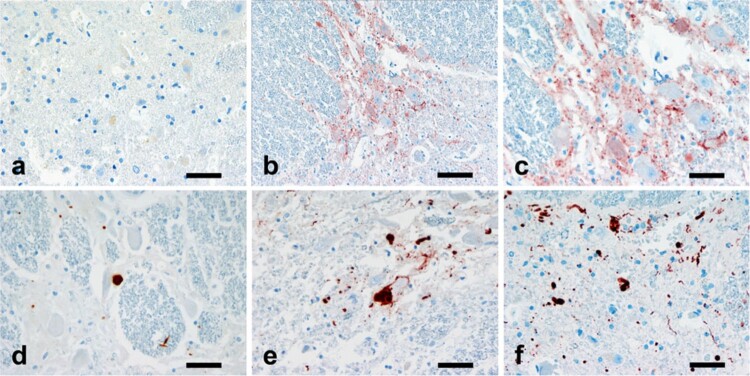
Figure 6.
A semiquantitative assessment of the αS pathology in the spinal cord. The figures illustrating the increasing severity of the immunoreactivity in the intermediolateral column of thoracocspinal cord from negative (a), to mini-aggregates with low magnification (b), mini-aggregates (c), mild (d), moderate (e) and severe (f) forms. αS immunostaining: magnification, 400× a and c–f 200×; b Scale bars, a, c–f 40 μm and b 80 μm. Reproduced with permission from Oinas et al.60

