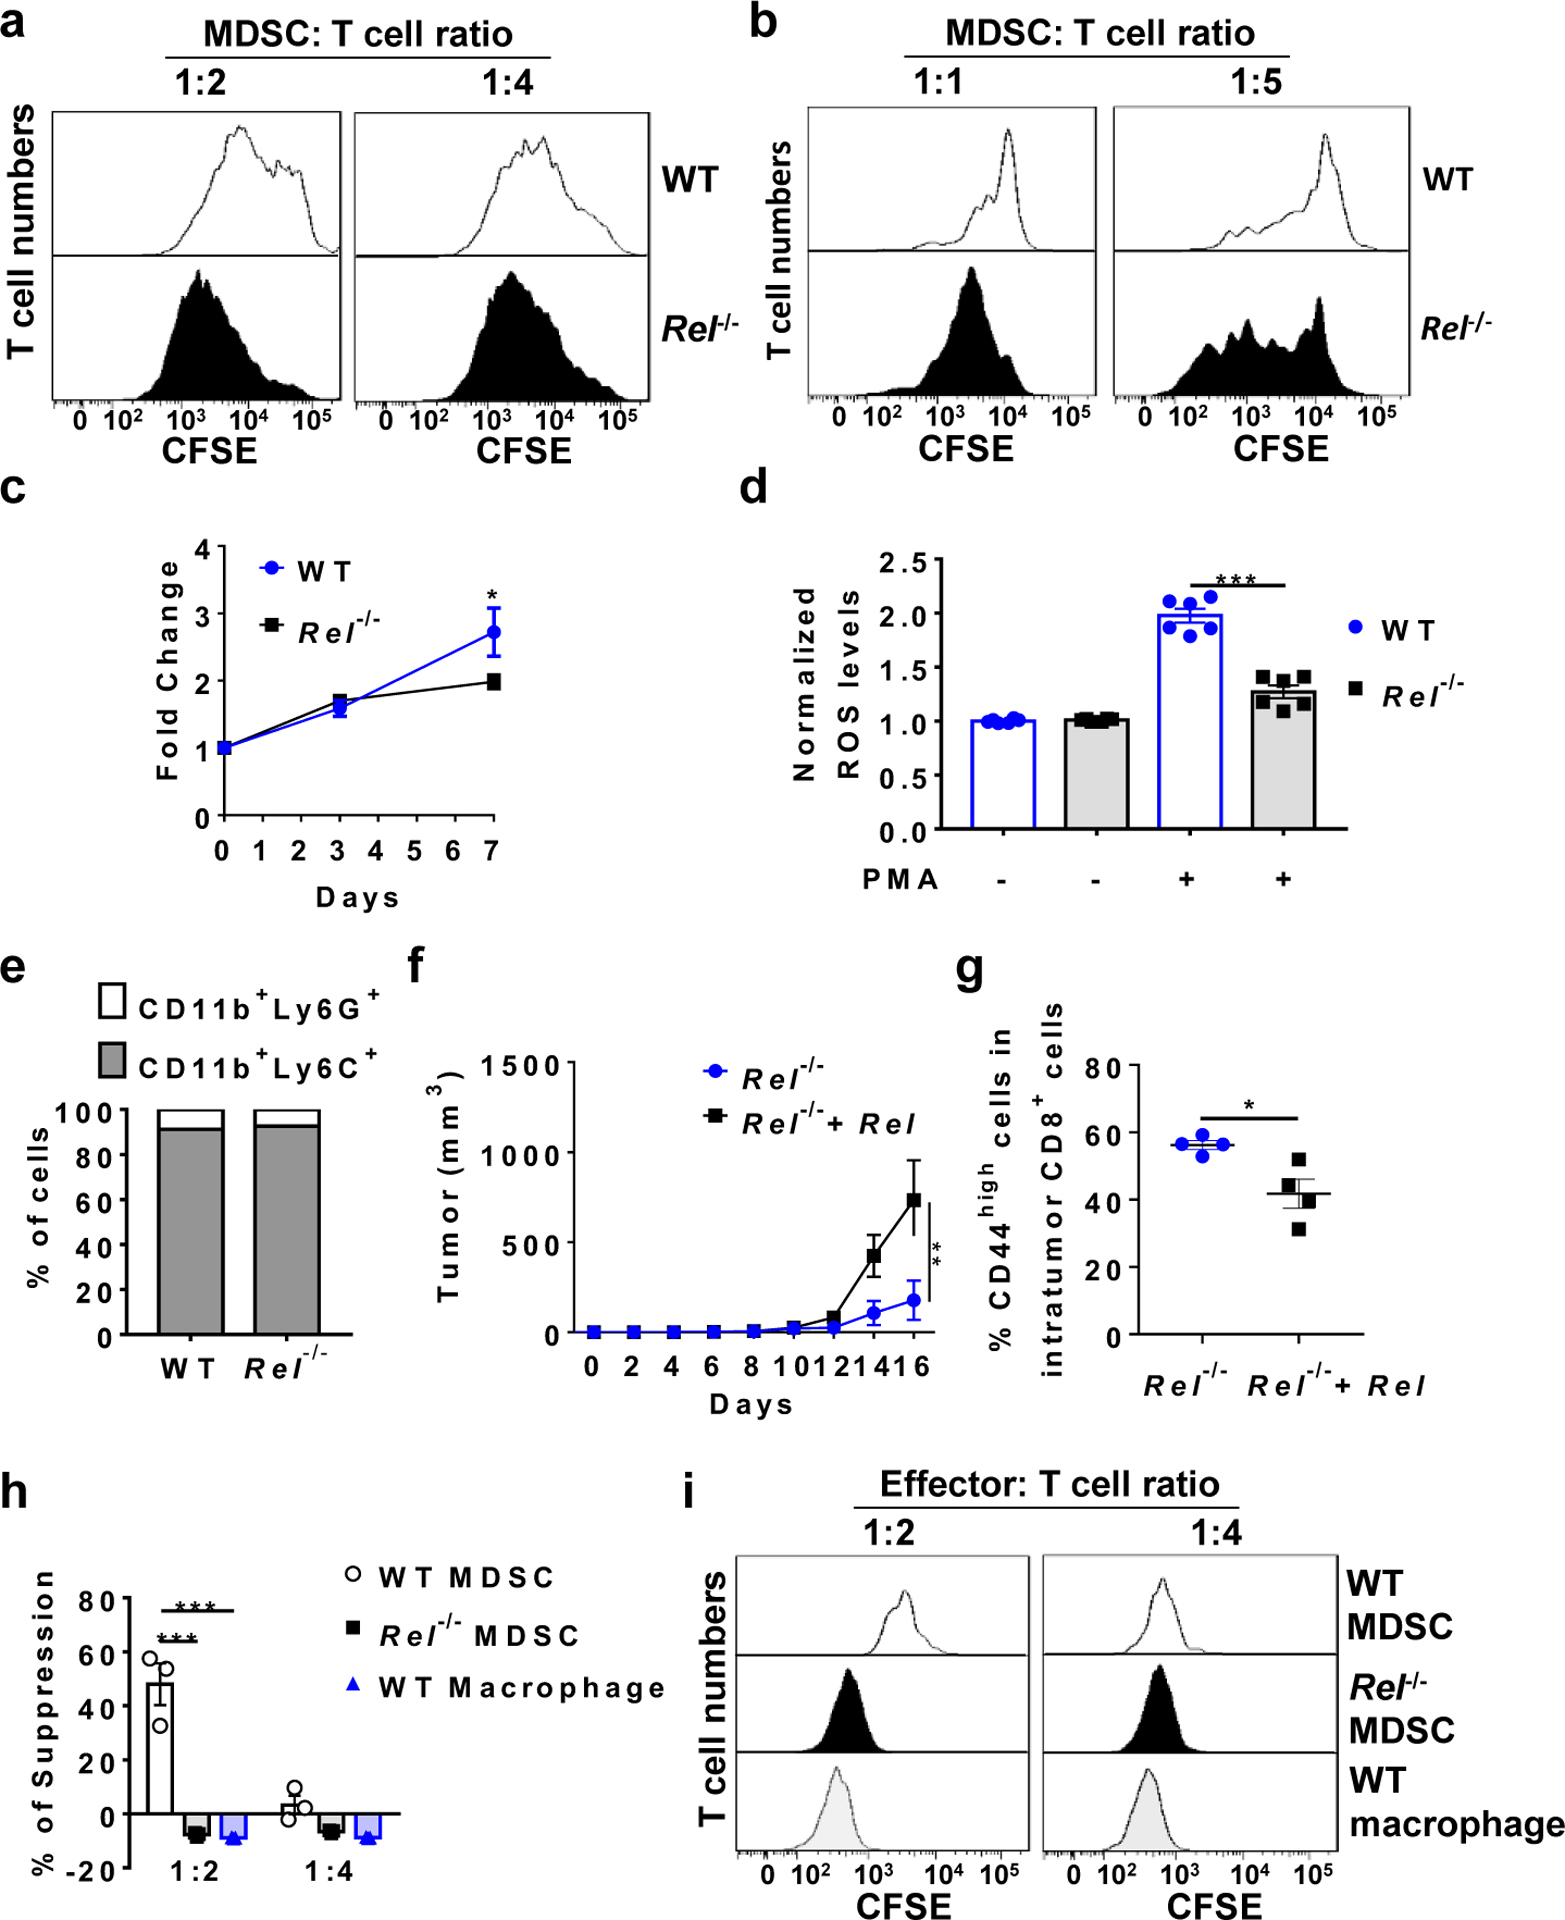
Extended Data Fig. 3 |. Reduced suppressive function, reactive oxygen species (ROS) production, and cell growth in Rel−/− MDSCs.

a, b, Representative flow cytometry plots from the MDSC-T cell suppression assay for Fig. 2a (a) and Fig. 2b (b). c, Growth of bone marrowderived MDSCs from WT (n=4 mice/group) and Rel−/− (n=9 mice/group) mice (*, P=0.03299). d, ROS production by bone marrow-derived MDSCs from WT and Rel−/− mice (n=6 mice/group; ***, P<0.0001). e, Percentages of CD11b+Ly6G+ and CD11b+Ly6C+ cells in bone marrow-derived MDSCs from WT and Rel−/− mice. Data representative of three independent experiments. f, Tumor growth in WT mice injected s.c. with B16F10 tumor cells plus Rel−/− MDSCs infected with control (n=5 mice) or Rel-expressing retroviruses (n=6 mice) (**, P=0.0041). g, Percentages of CD44high cells in intratumor CD8+ cells of WT mice treated as in panel f. (n=4 mice/group; *, P=0.0187). h, The degree of suppression, at the indicated Effector:T cell ratio, of CD8+ T cell Extended Data proliferation by bone marrow-derived MDSCs and BMDMs from naïve mice (n=3 mice/group). The concentrations of anti-CD3 and anti-CD28 used (125 ng/mL each) were half of those in Fig. 2b (***, P<0.0001). i, Representative flow cytometry plots for the MDSC-T cell suppression assay for Panel h. Statistical significance was determined by two-tailed unpaired t-test (c-e, g), two-tailed Mann-Whitney U-test (f), or two-way ANOVA with Turkey post-hoc test (h). Data are presented as means ± s.e.m. (c, d, f, h).
