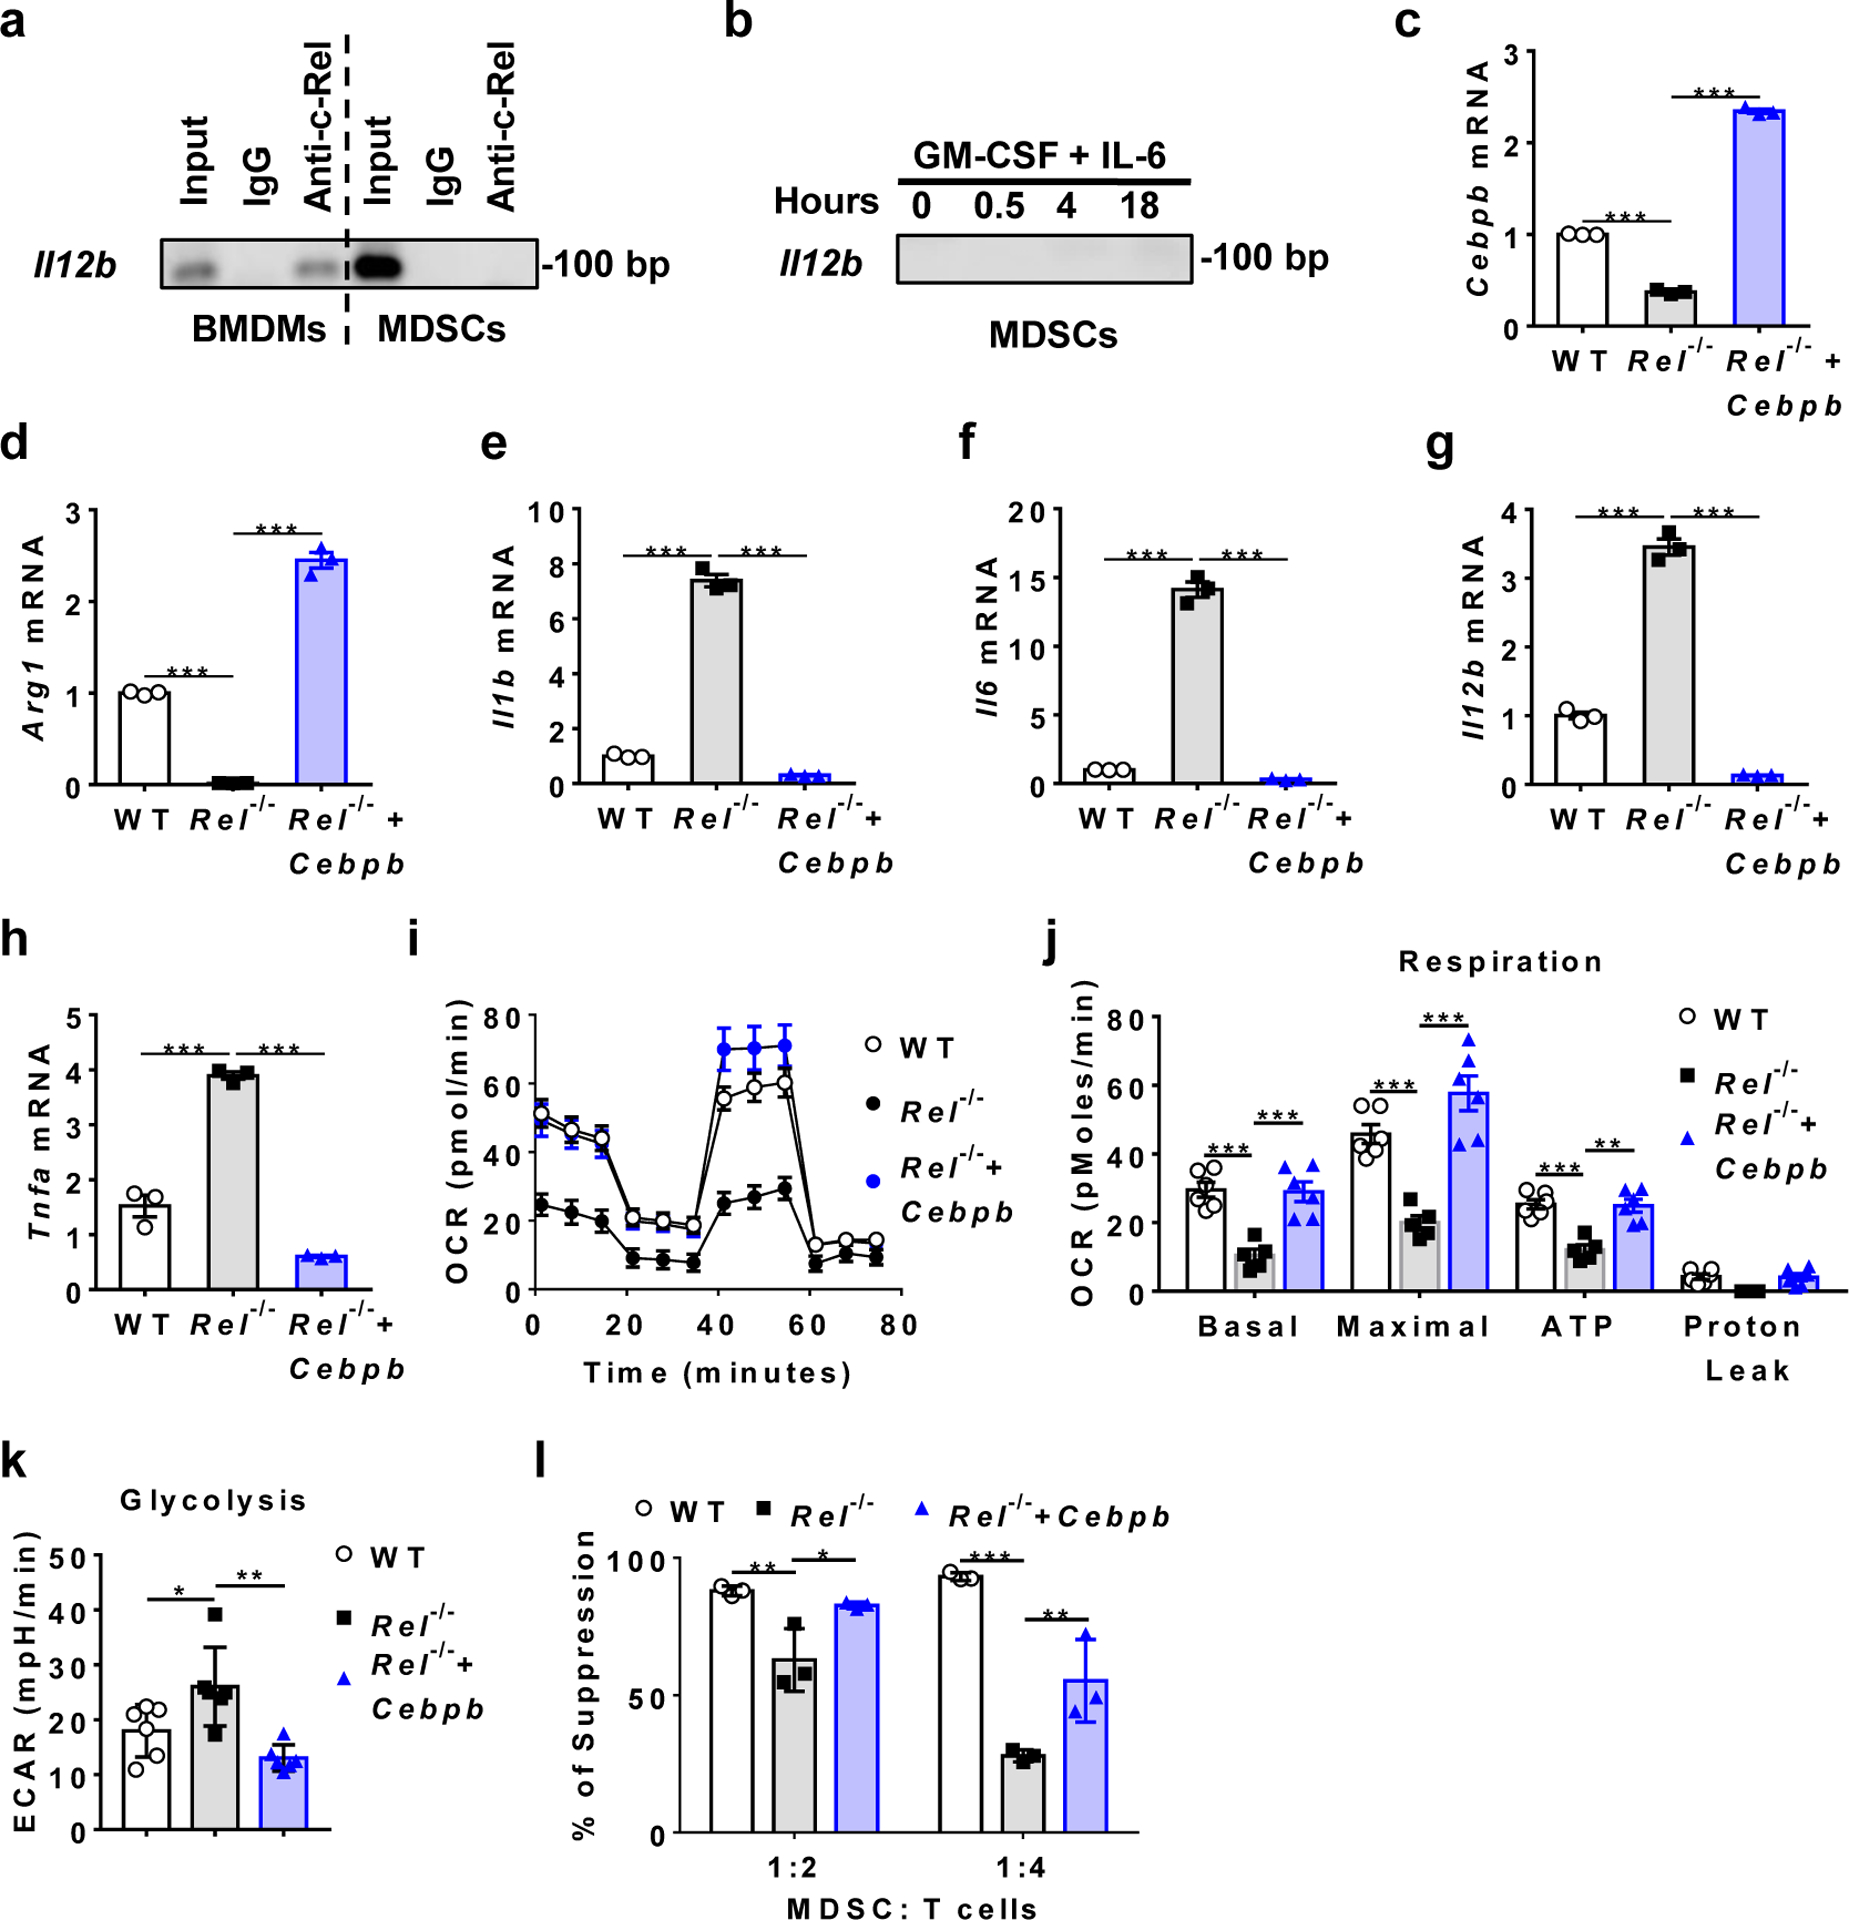
Fig. 5. c-Rel regulates MDSC gene expression, metabolism, and suppressive function via Cebpb.

a, b, Measuring c-Rel binding to the Il12b gene promoter in resting BMDMs and MDSCs (a), or MDSCs treated with GM-CSF and IL-6 (b), by ChIP with anti-c-Rel. Input DNA and IgG were used as controls.
c-h, Relative mRNA levels of the indicated genes in bone marrow-derived WT MDSCs infected with control virus (WT), Rel−/− MDSCs infected with control virus (Rel−/−), and Rel−/− MDSCs infected with Cebpb-expressing virus (Rel−/−+ Cebpb). n=3 biologically independent cultures/group (***, P<0.0001).
i, Mitochondrial oxygen consumption rate (OCR) in the WT (n=6 cultures), Rel−/− (n=5 cultures), and Rel−/−+ Cebpb (n=6 cultures) MDSCs as measured by Seahorse XF96 analyzer.
j, Basal respiration, maximal respiration, ATP production, and proton leak in the WT (n=6 cultures), Rel−/− (n=5 cultures), and Rel−/−+ Cebpb (n=6 cultures) MDSCs as measured in i (**, P=0.0012; ***, P<0.001).
k, Basal glycolysis and maximal glycolysis in the indicated groups of MDSCs (n=6 cultures/group) measured using a Seahorse XF96 analyzer (*, P=0.0416; **, P=0.0015).
l, The degree of suppression of CD8+ T cell proliferation by MDSCs (n=3 cultures/group) shown in panel c (*, P=0.023; **, P<0.01, ***, P<0.0001).
Statistical significance was determined by one-way ANOVA with Turkey post-hoc test (c-h, k) or two-way ANOVA with Turkey post-hoc test (j, l). Data are presented as means ± s.e.m. (c-j).
